DTC E-Commerce
Amazon US
Brand Analytics
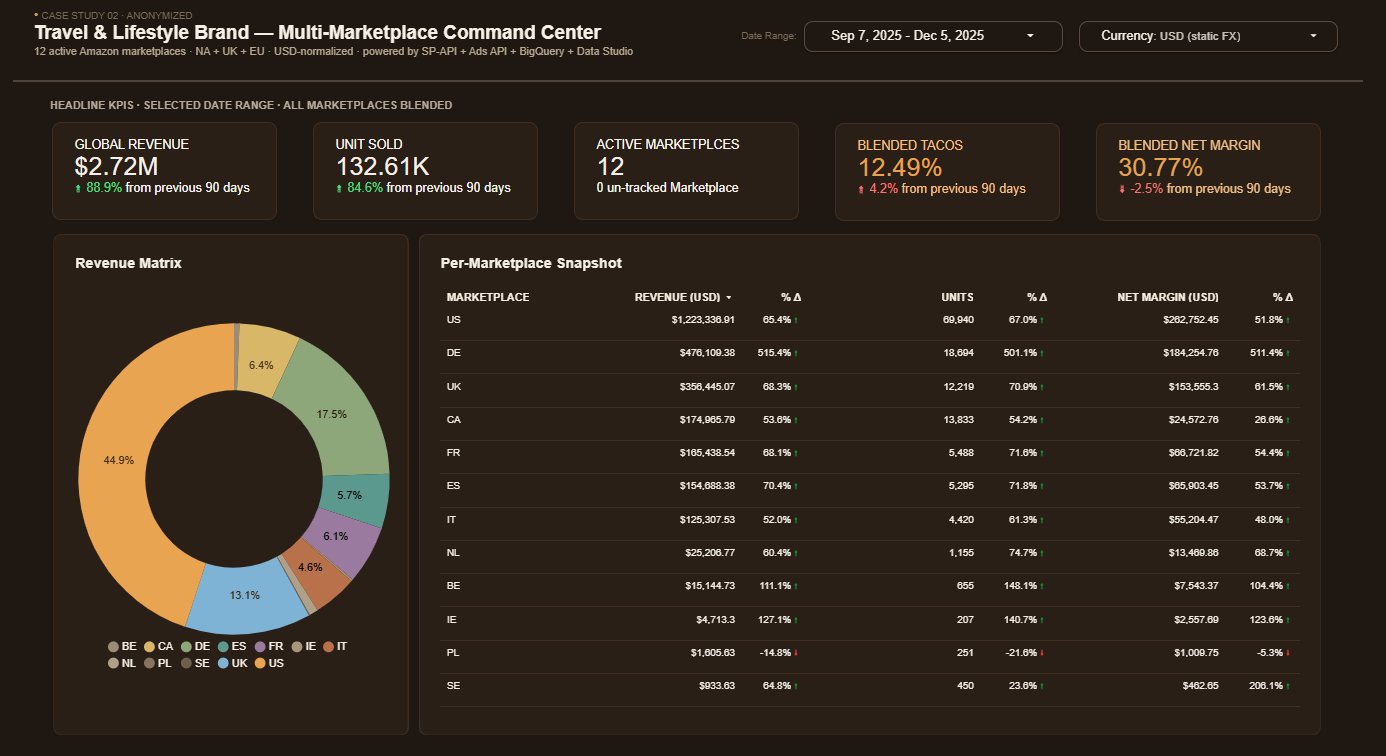
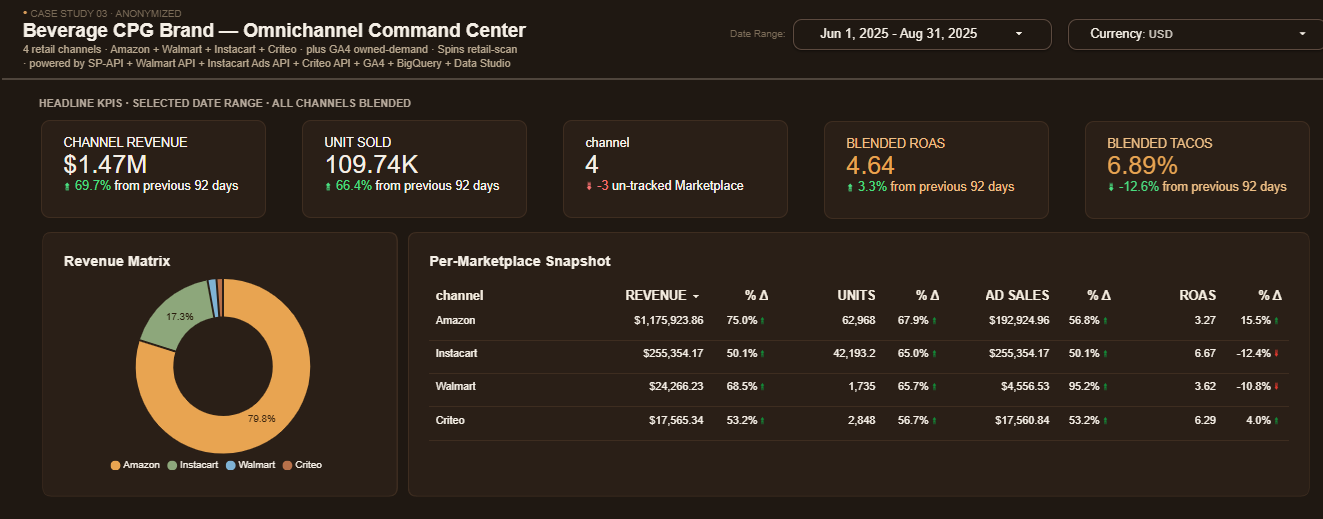
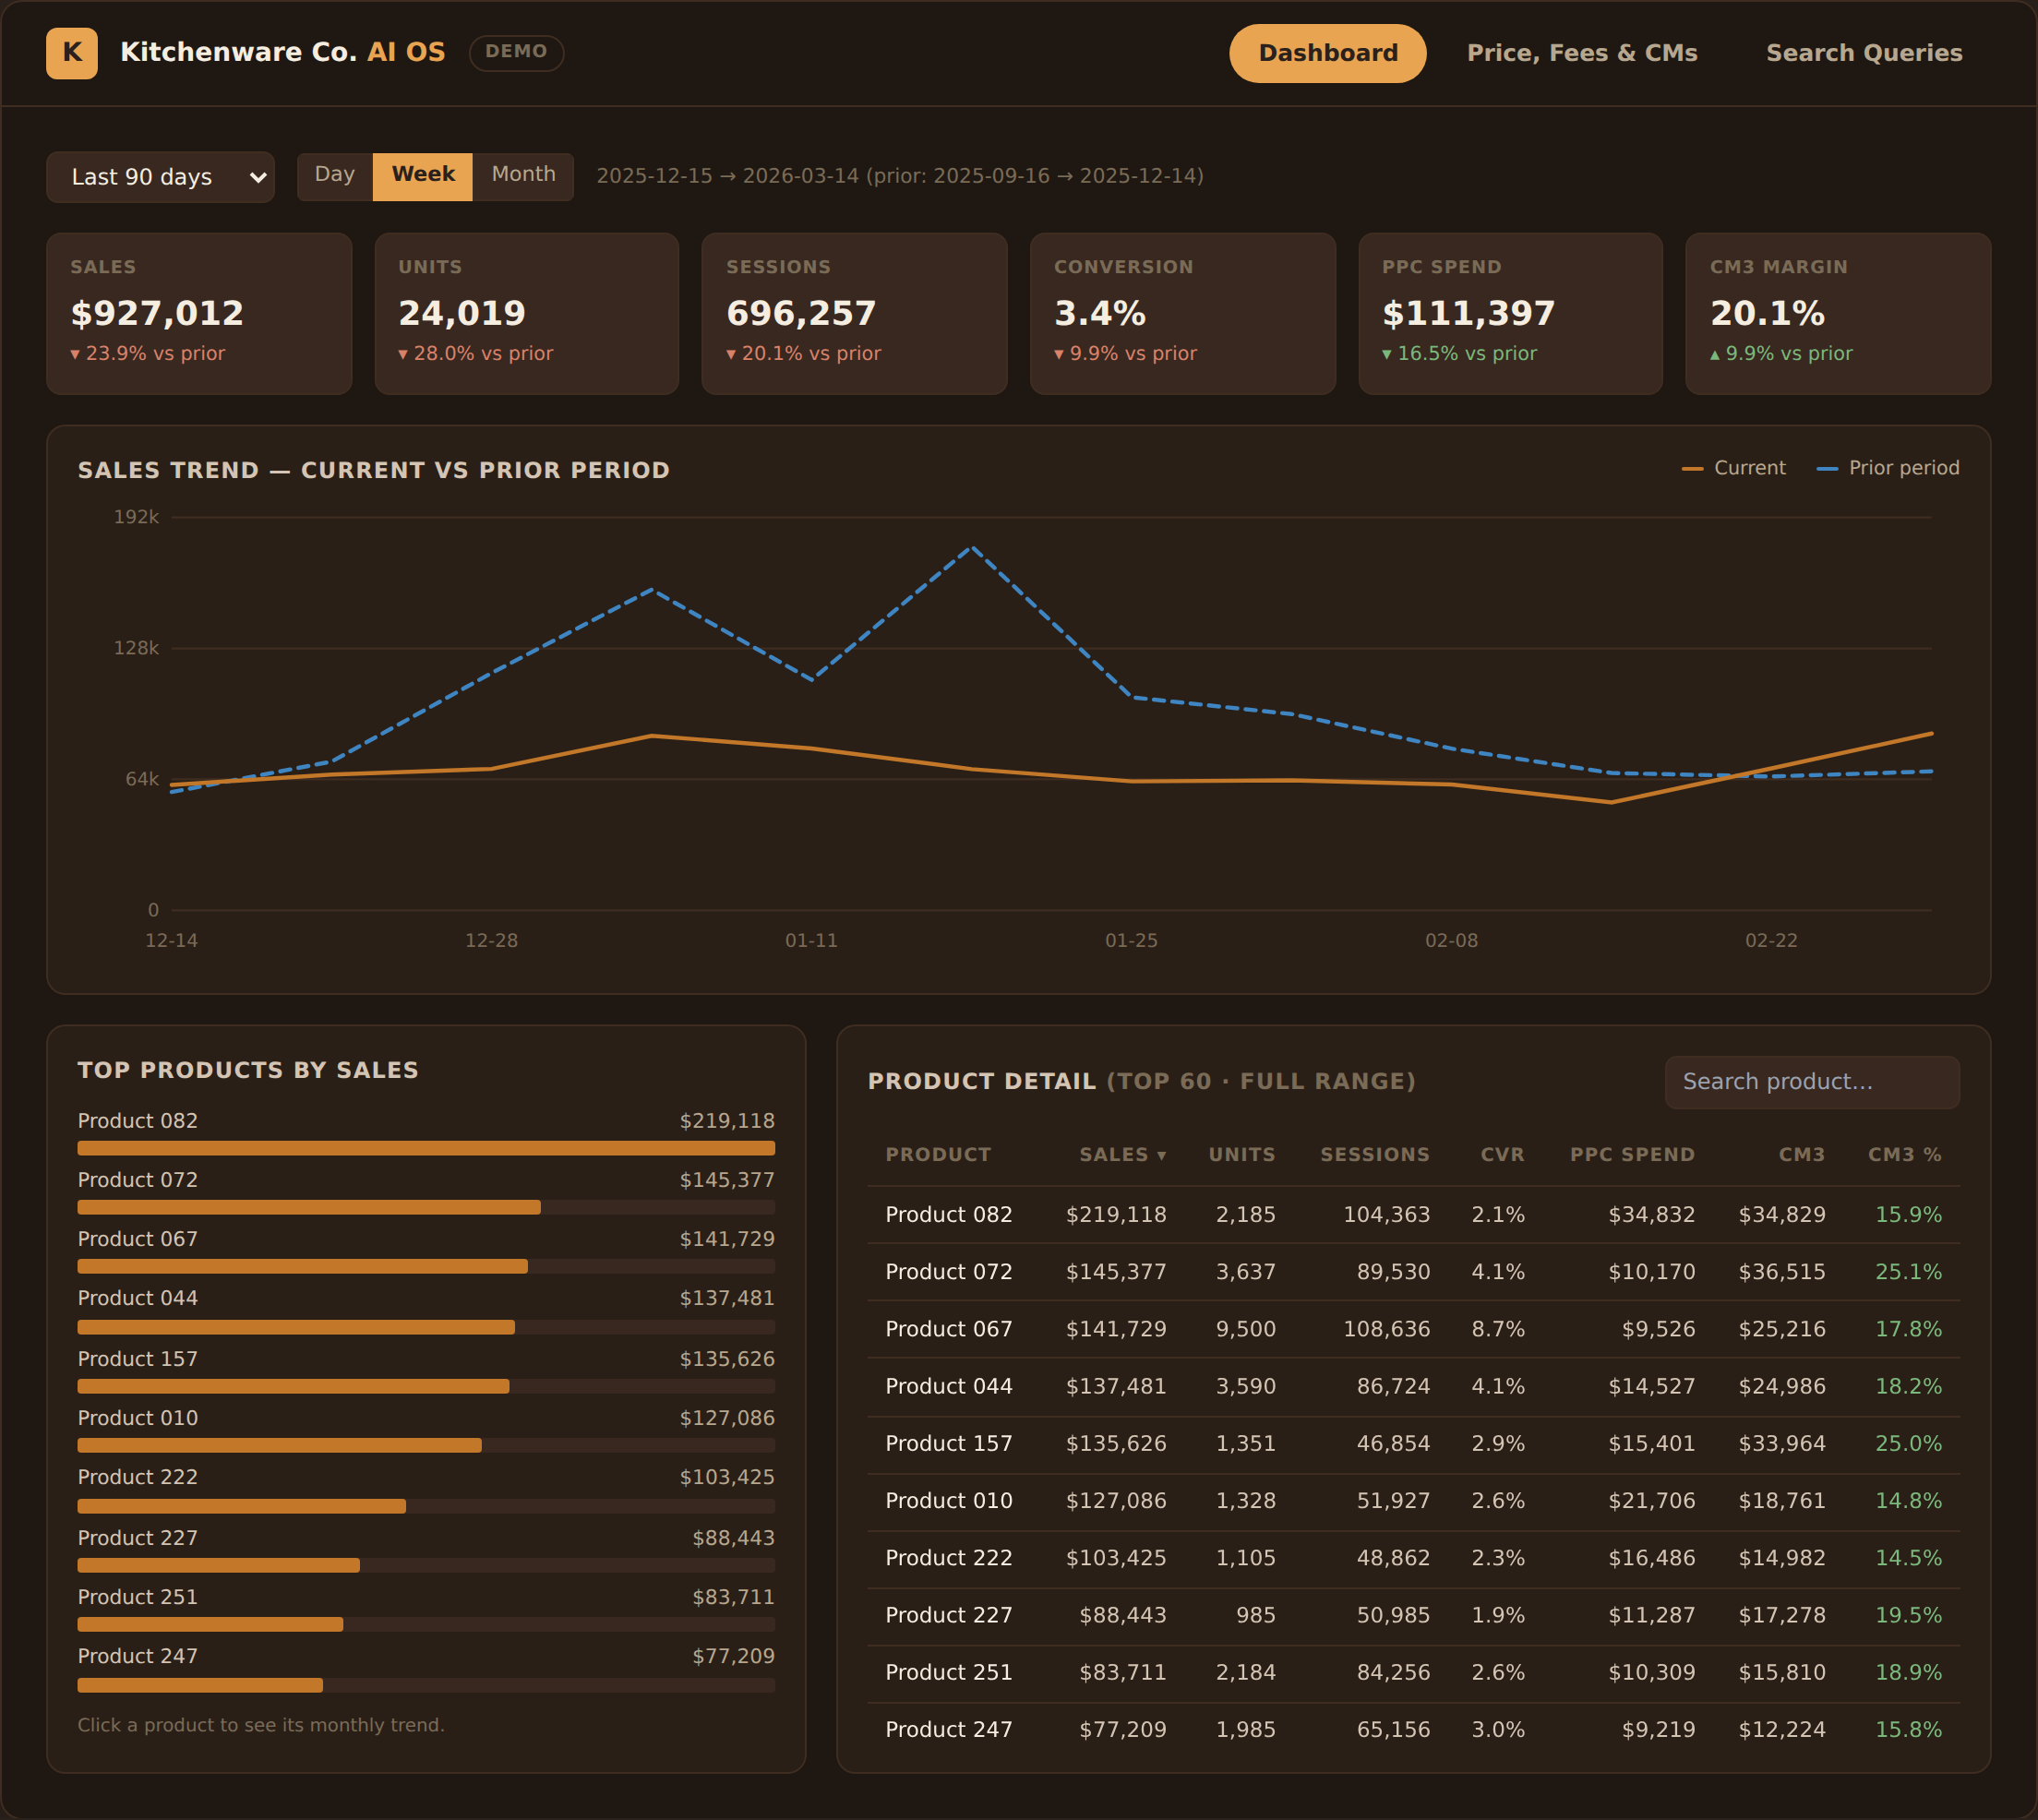
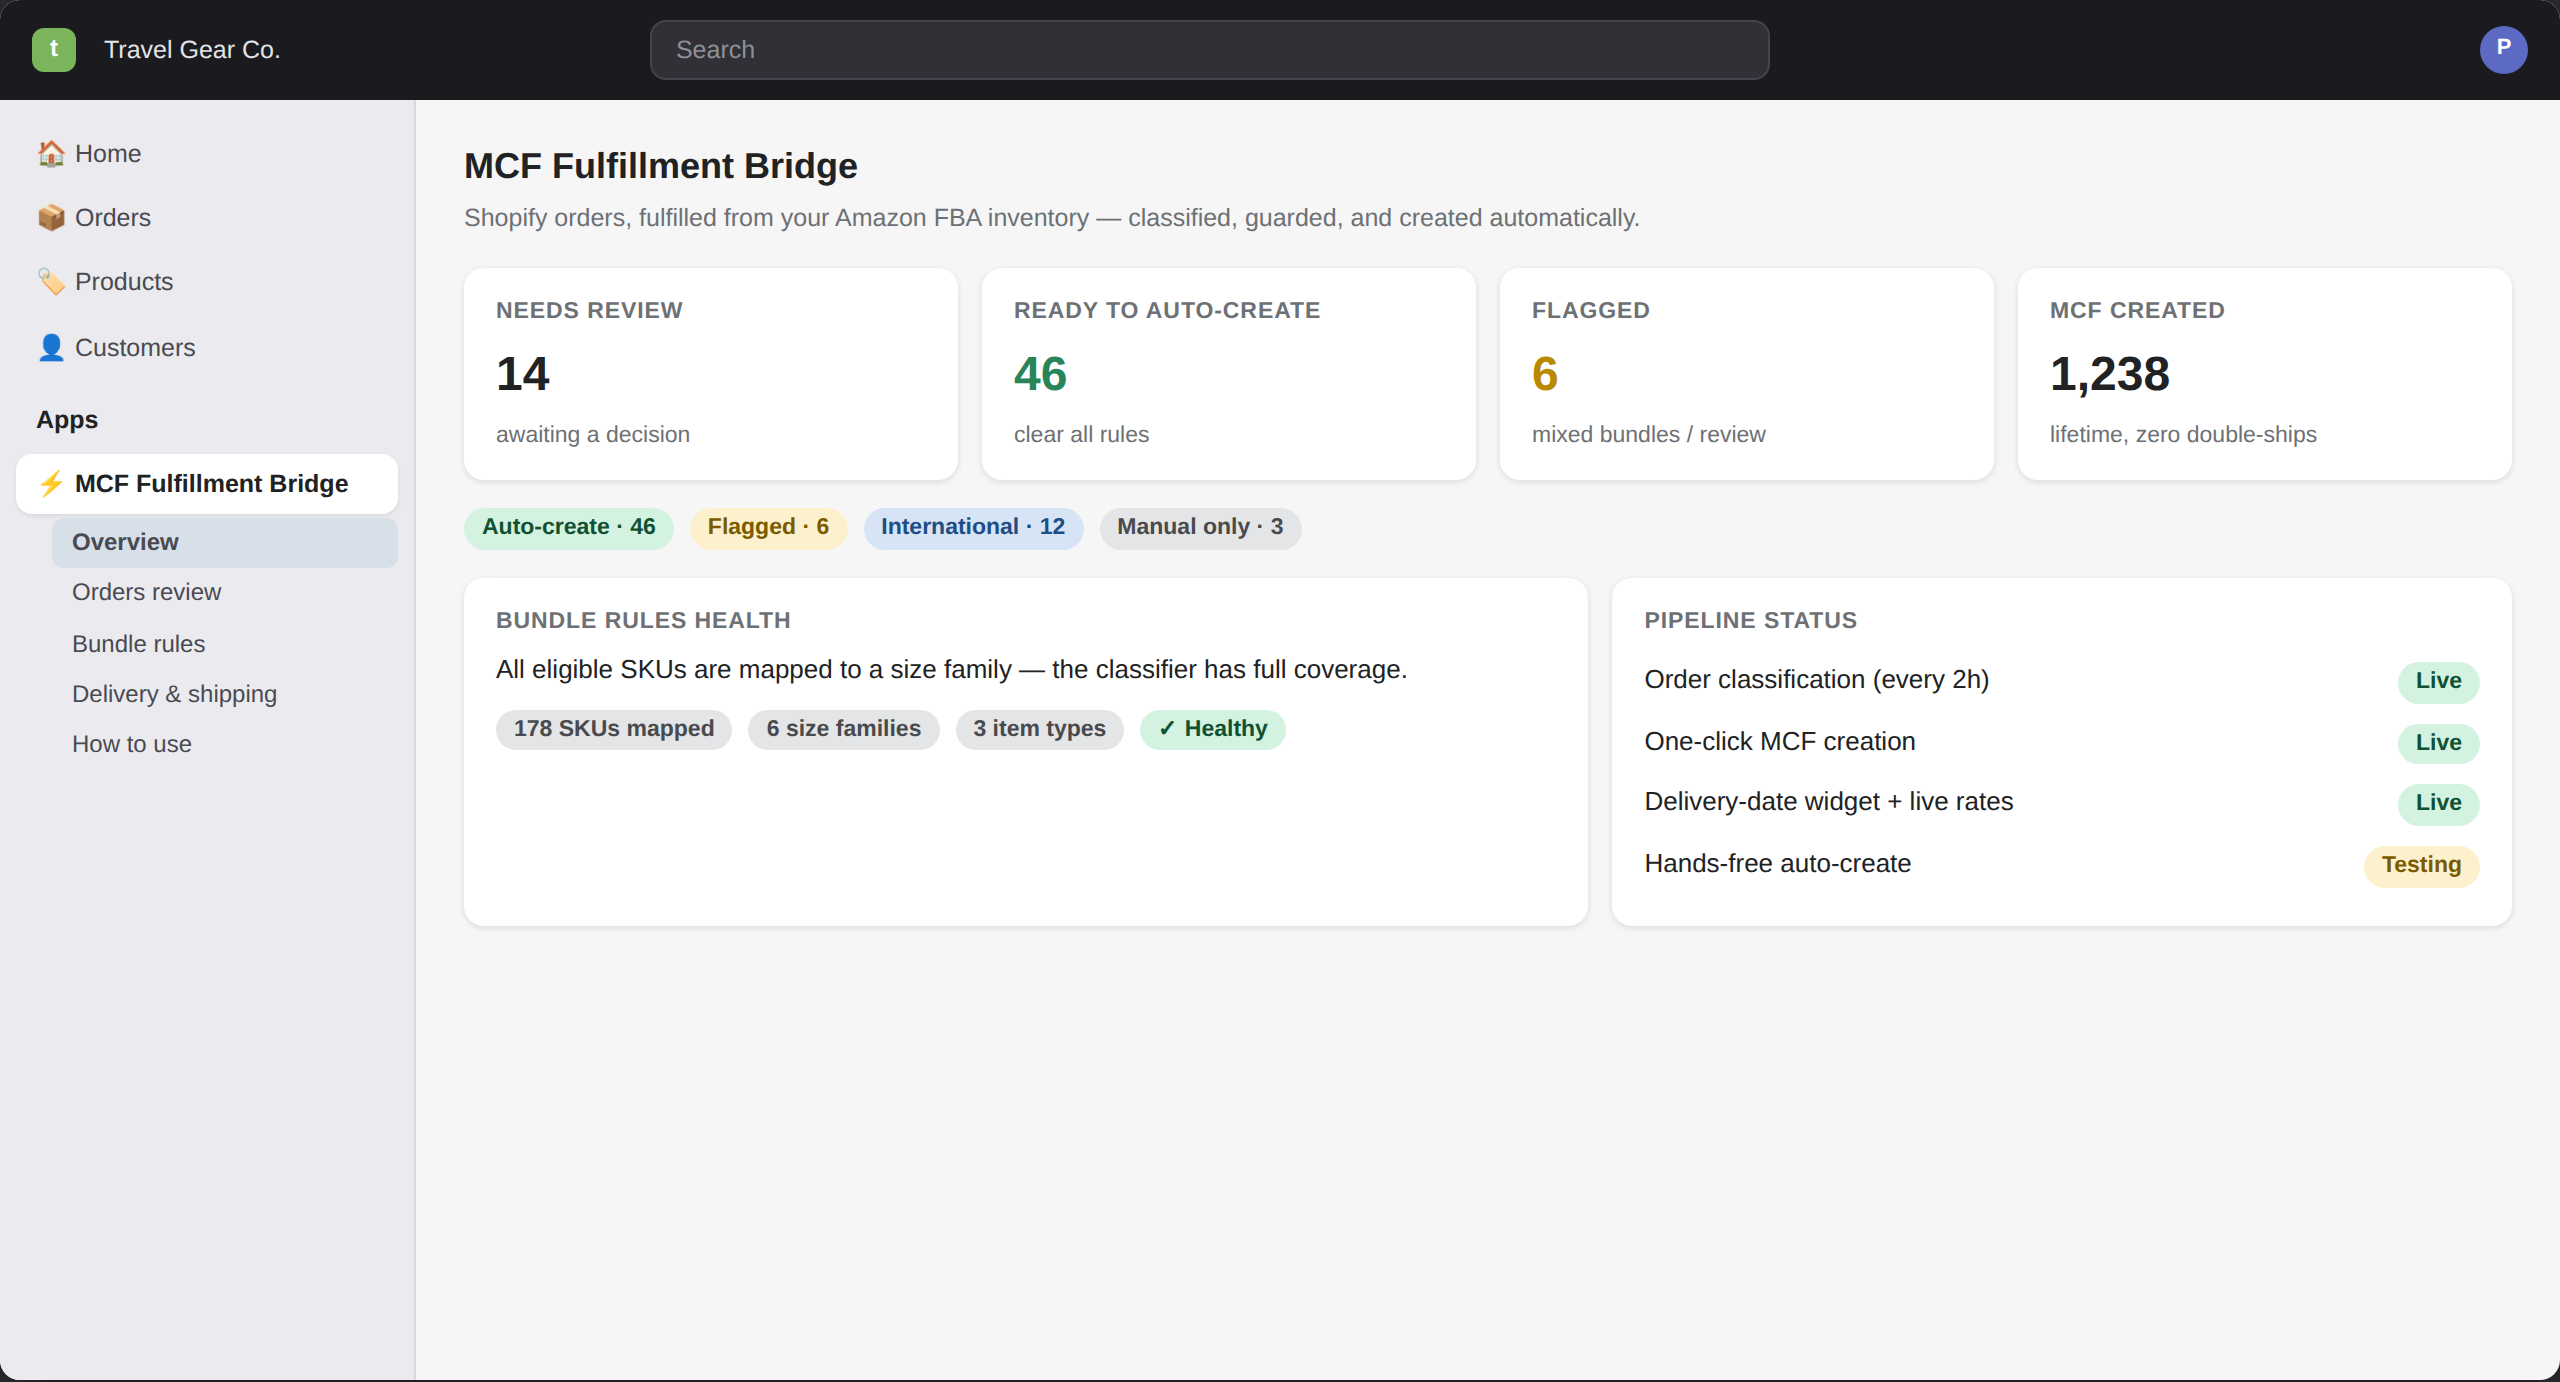
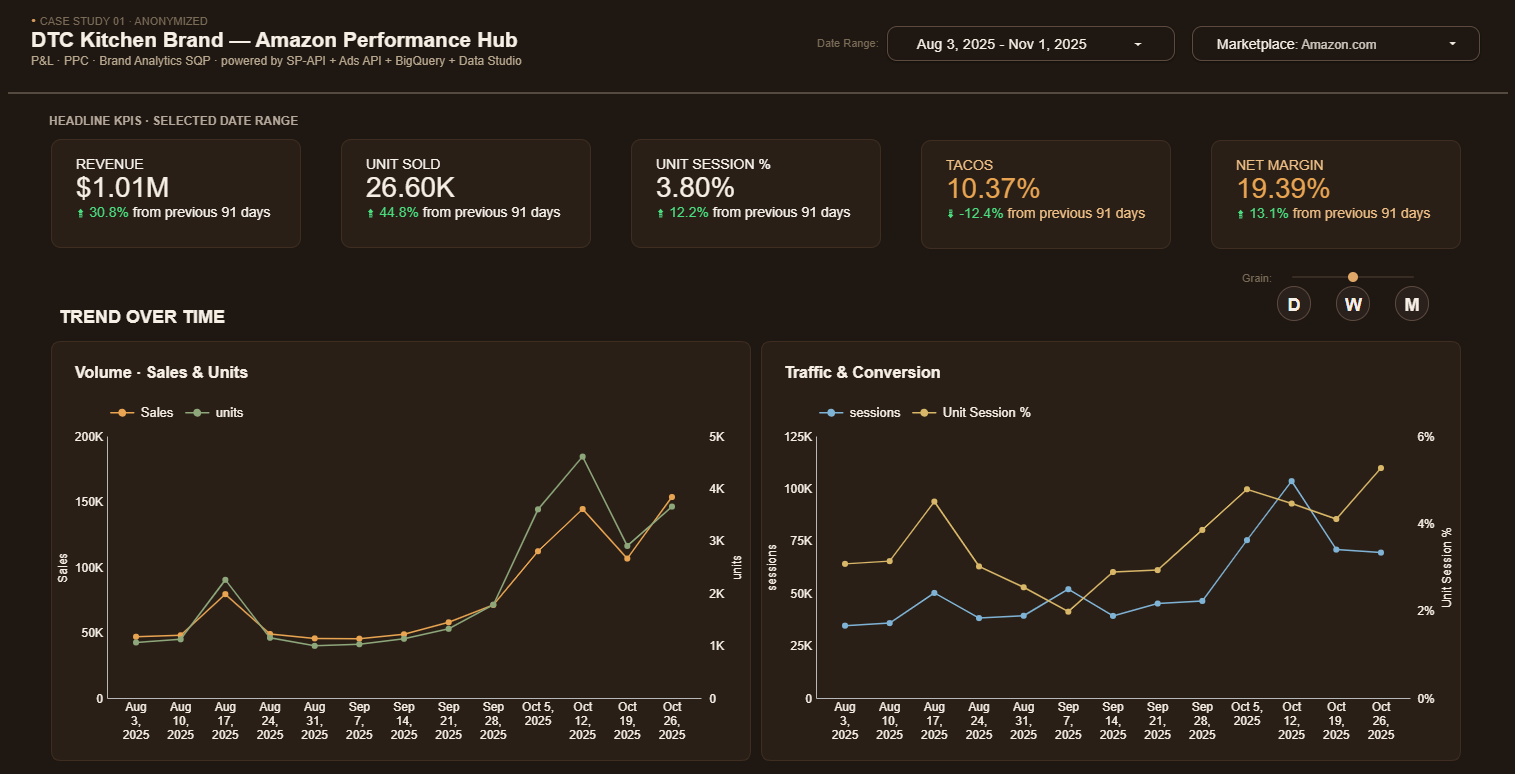
DTC Kitchen Brand — Amazon Performance Hub
A single dashboard covering 12 months of P&L, PPC, and Brand Analytics SQP — from raw Amazon APIs to one place the team checks every morning.
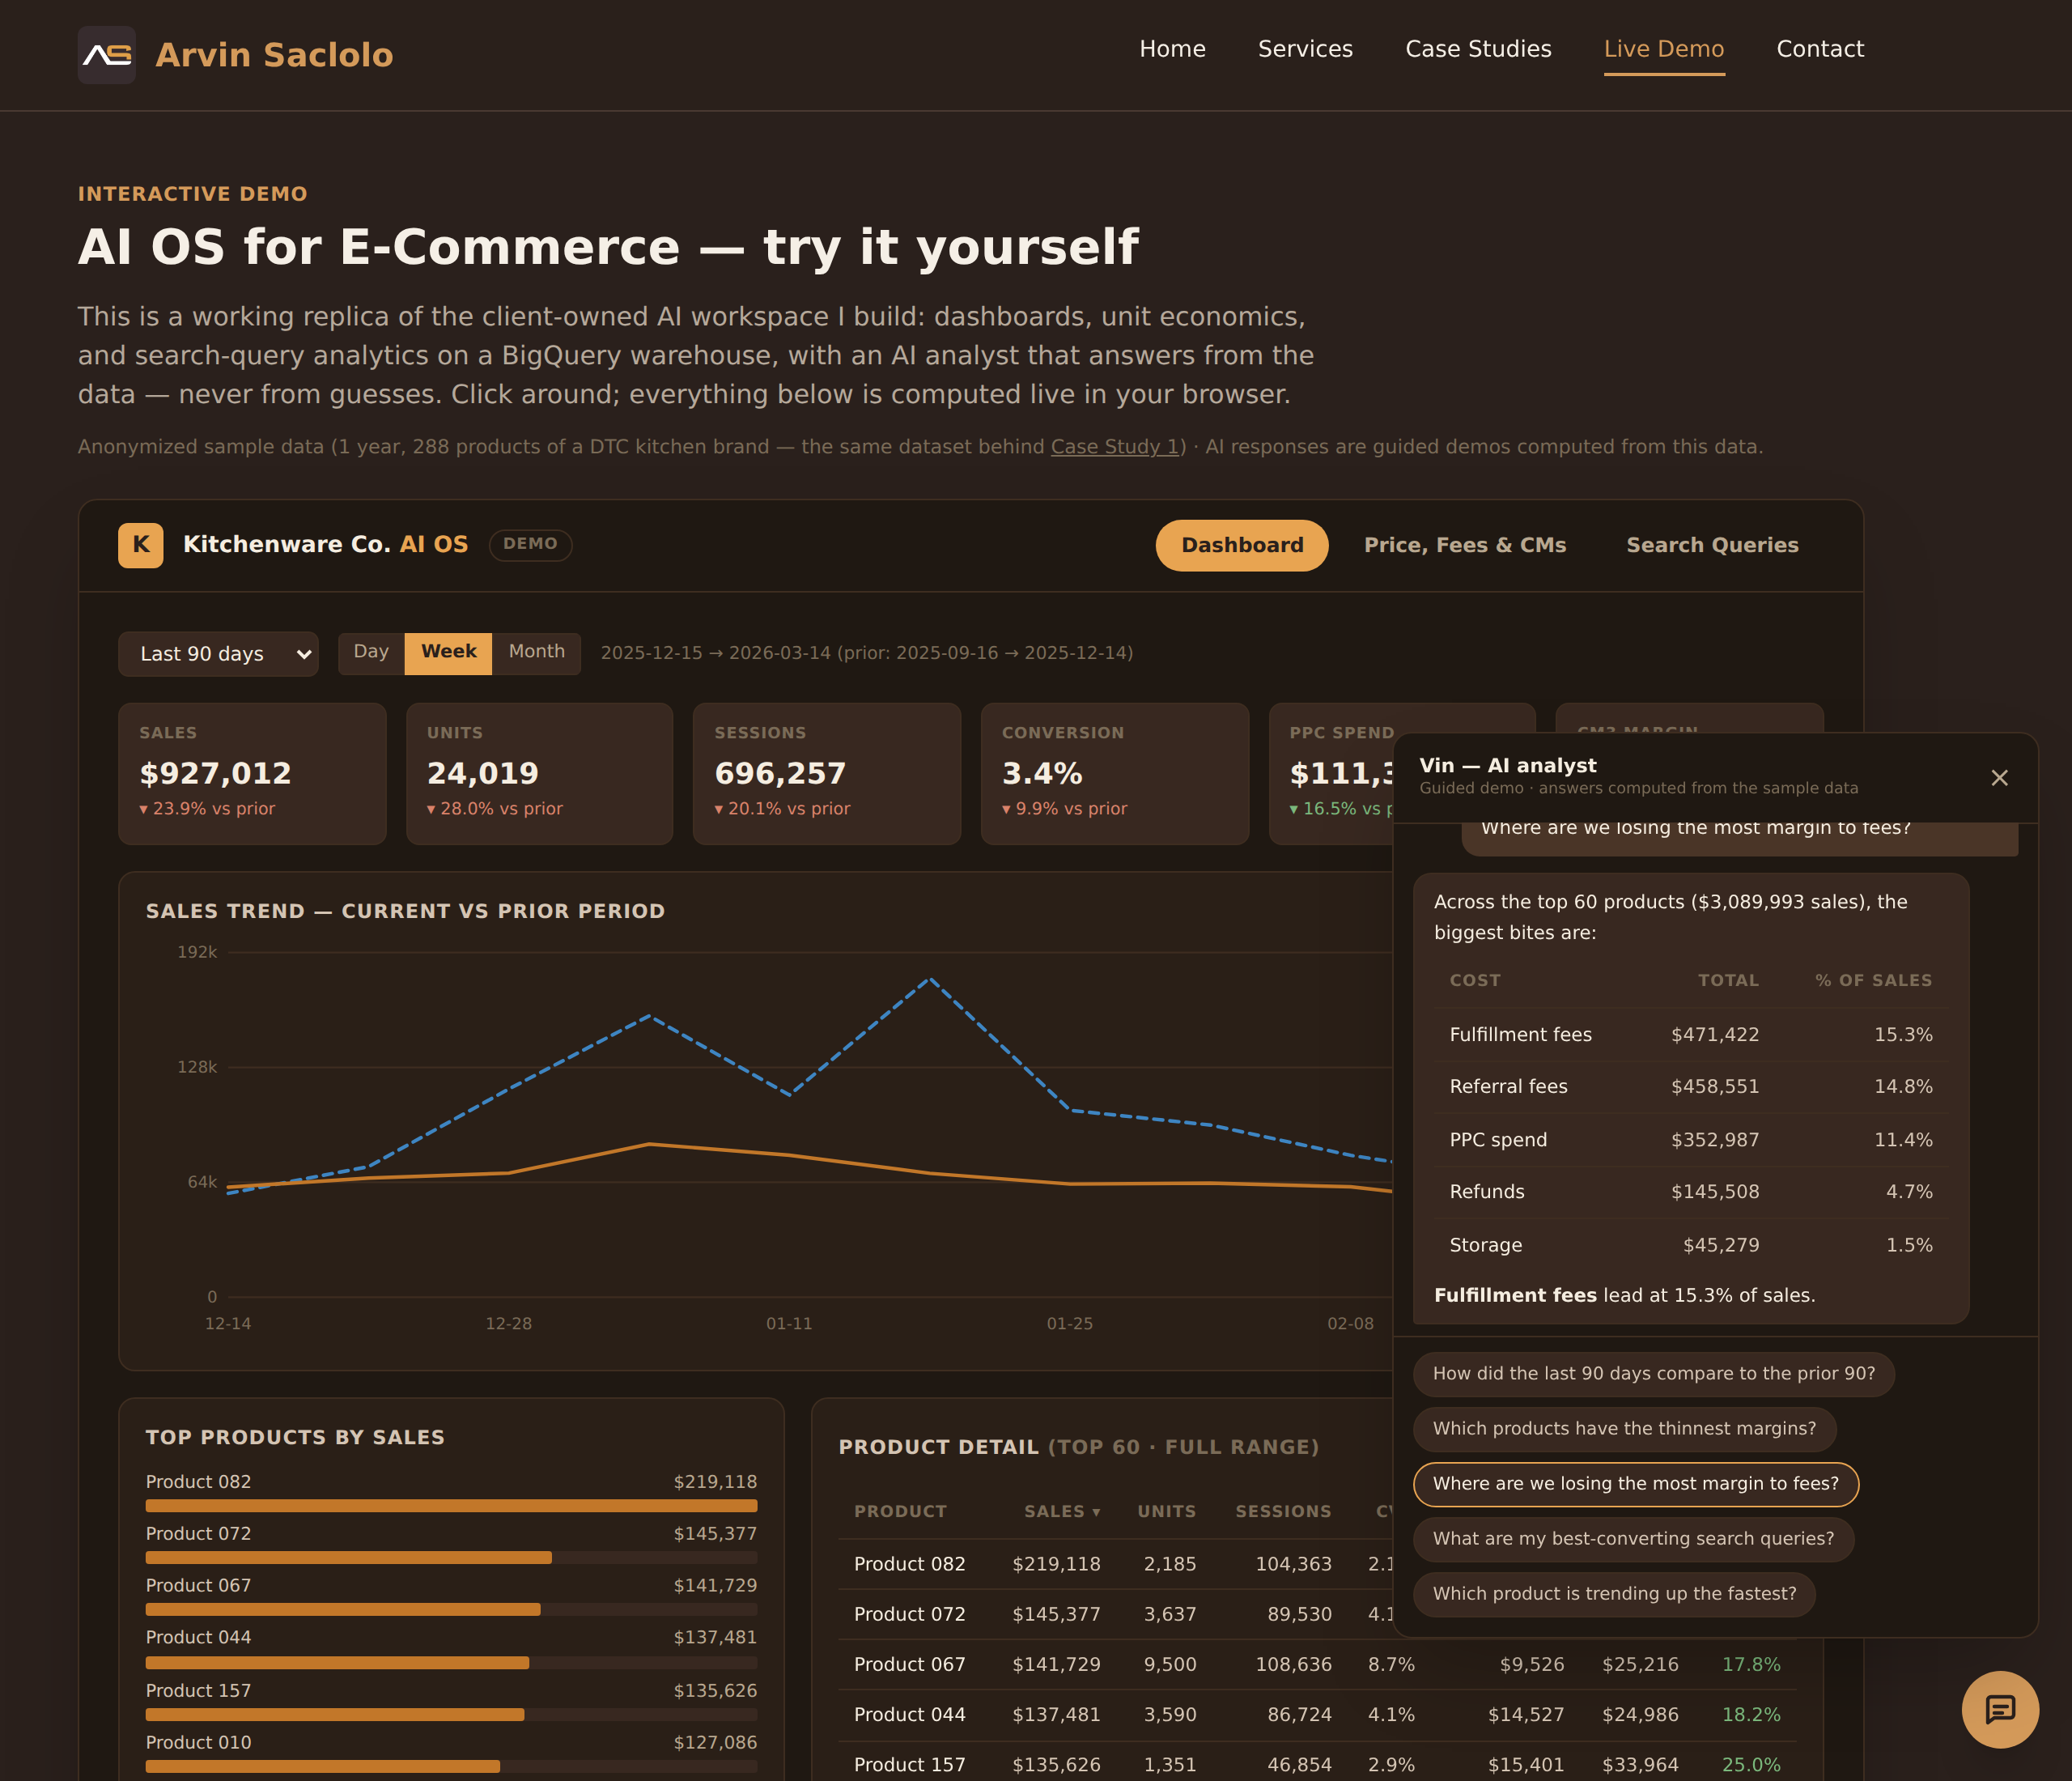
Click image to view the live dashboard →
The Challenge
The team was stitching together CSVs from Seller Central, Amazon Ads, and Brand Analytics every Monday morning — up to half a day of manual work just to answer "how did we do last week?" Margins were a black box because PPC, fees, and refunds lived in separate reports that nobody had time to reconcile against revenue.
What I Built
- ✓ Automated SP-API + Ads API pipelines into a partitioned BigQuery warehouse — daily refreshes, no manual exports
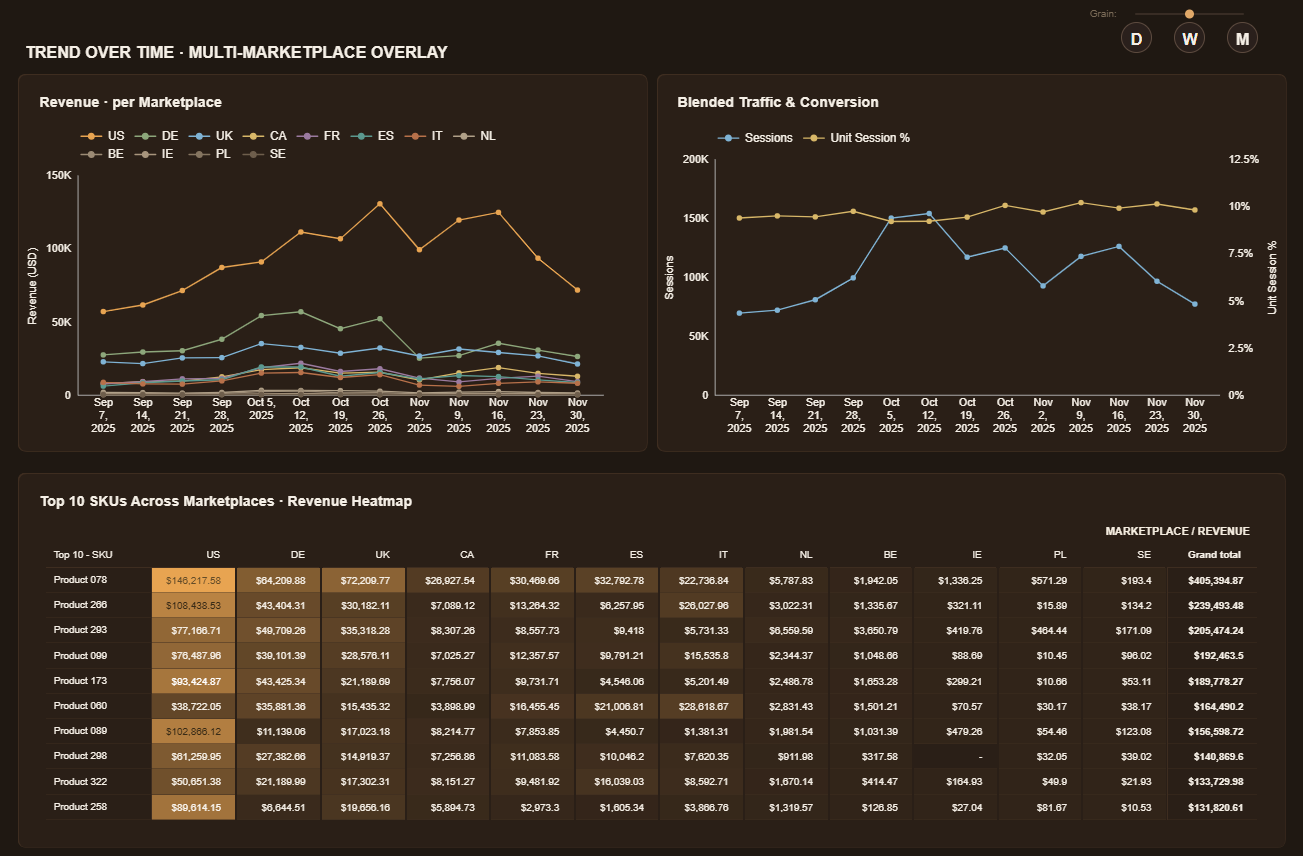
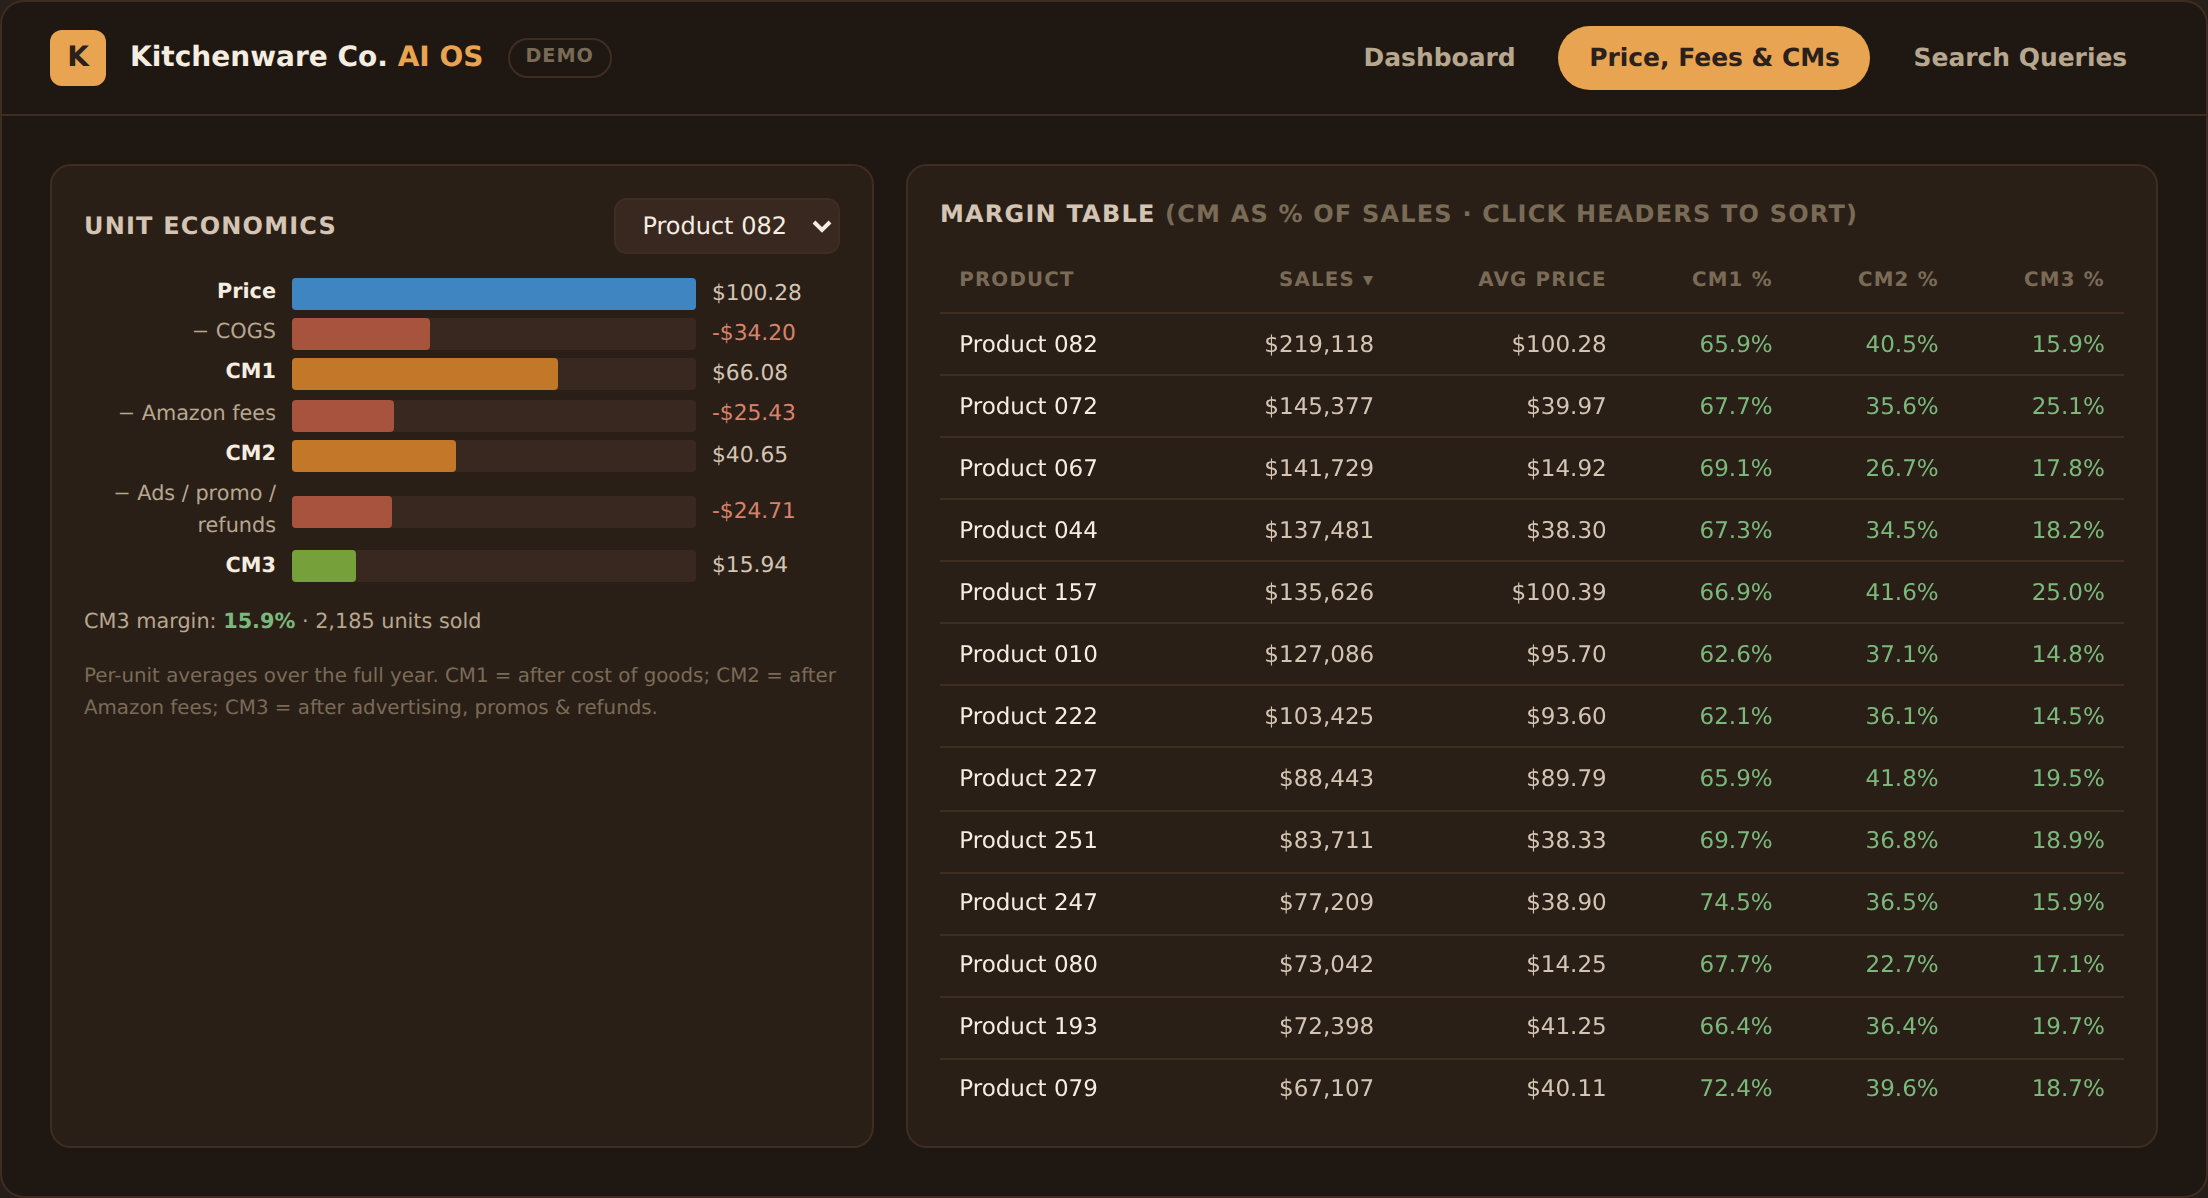
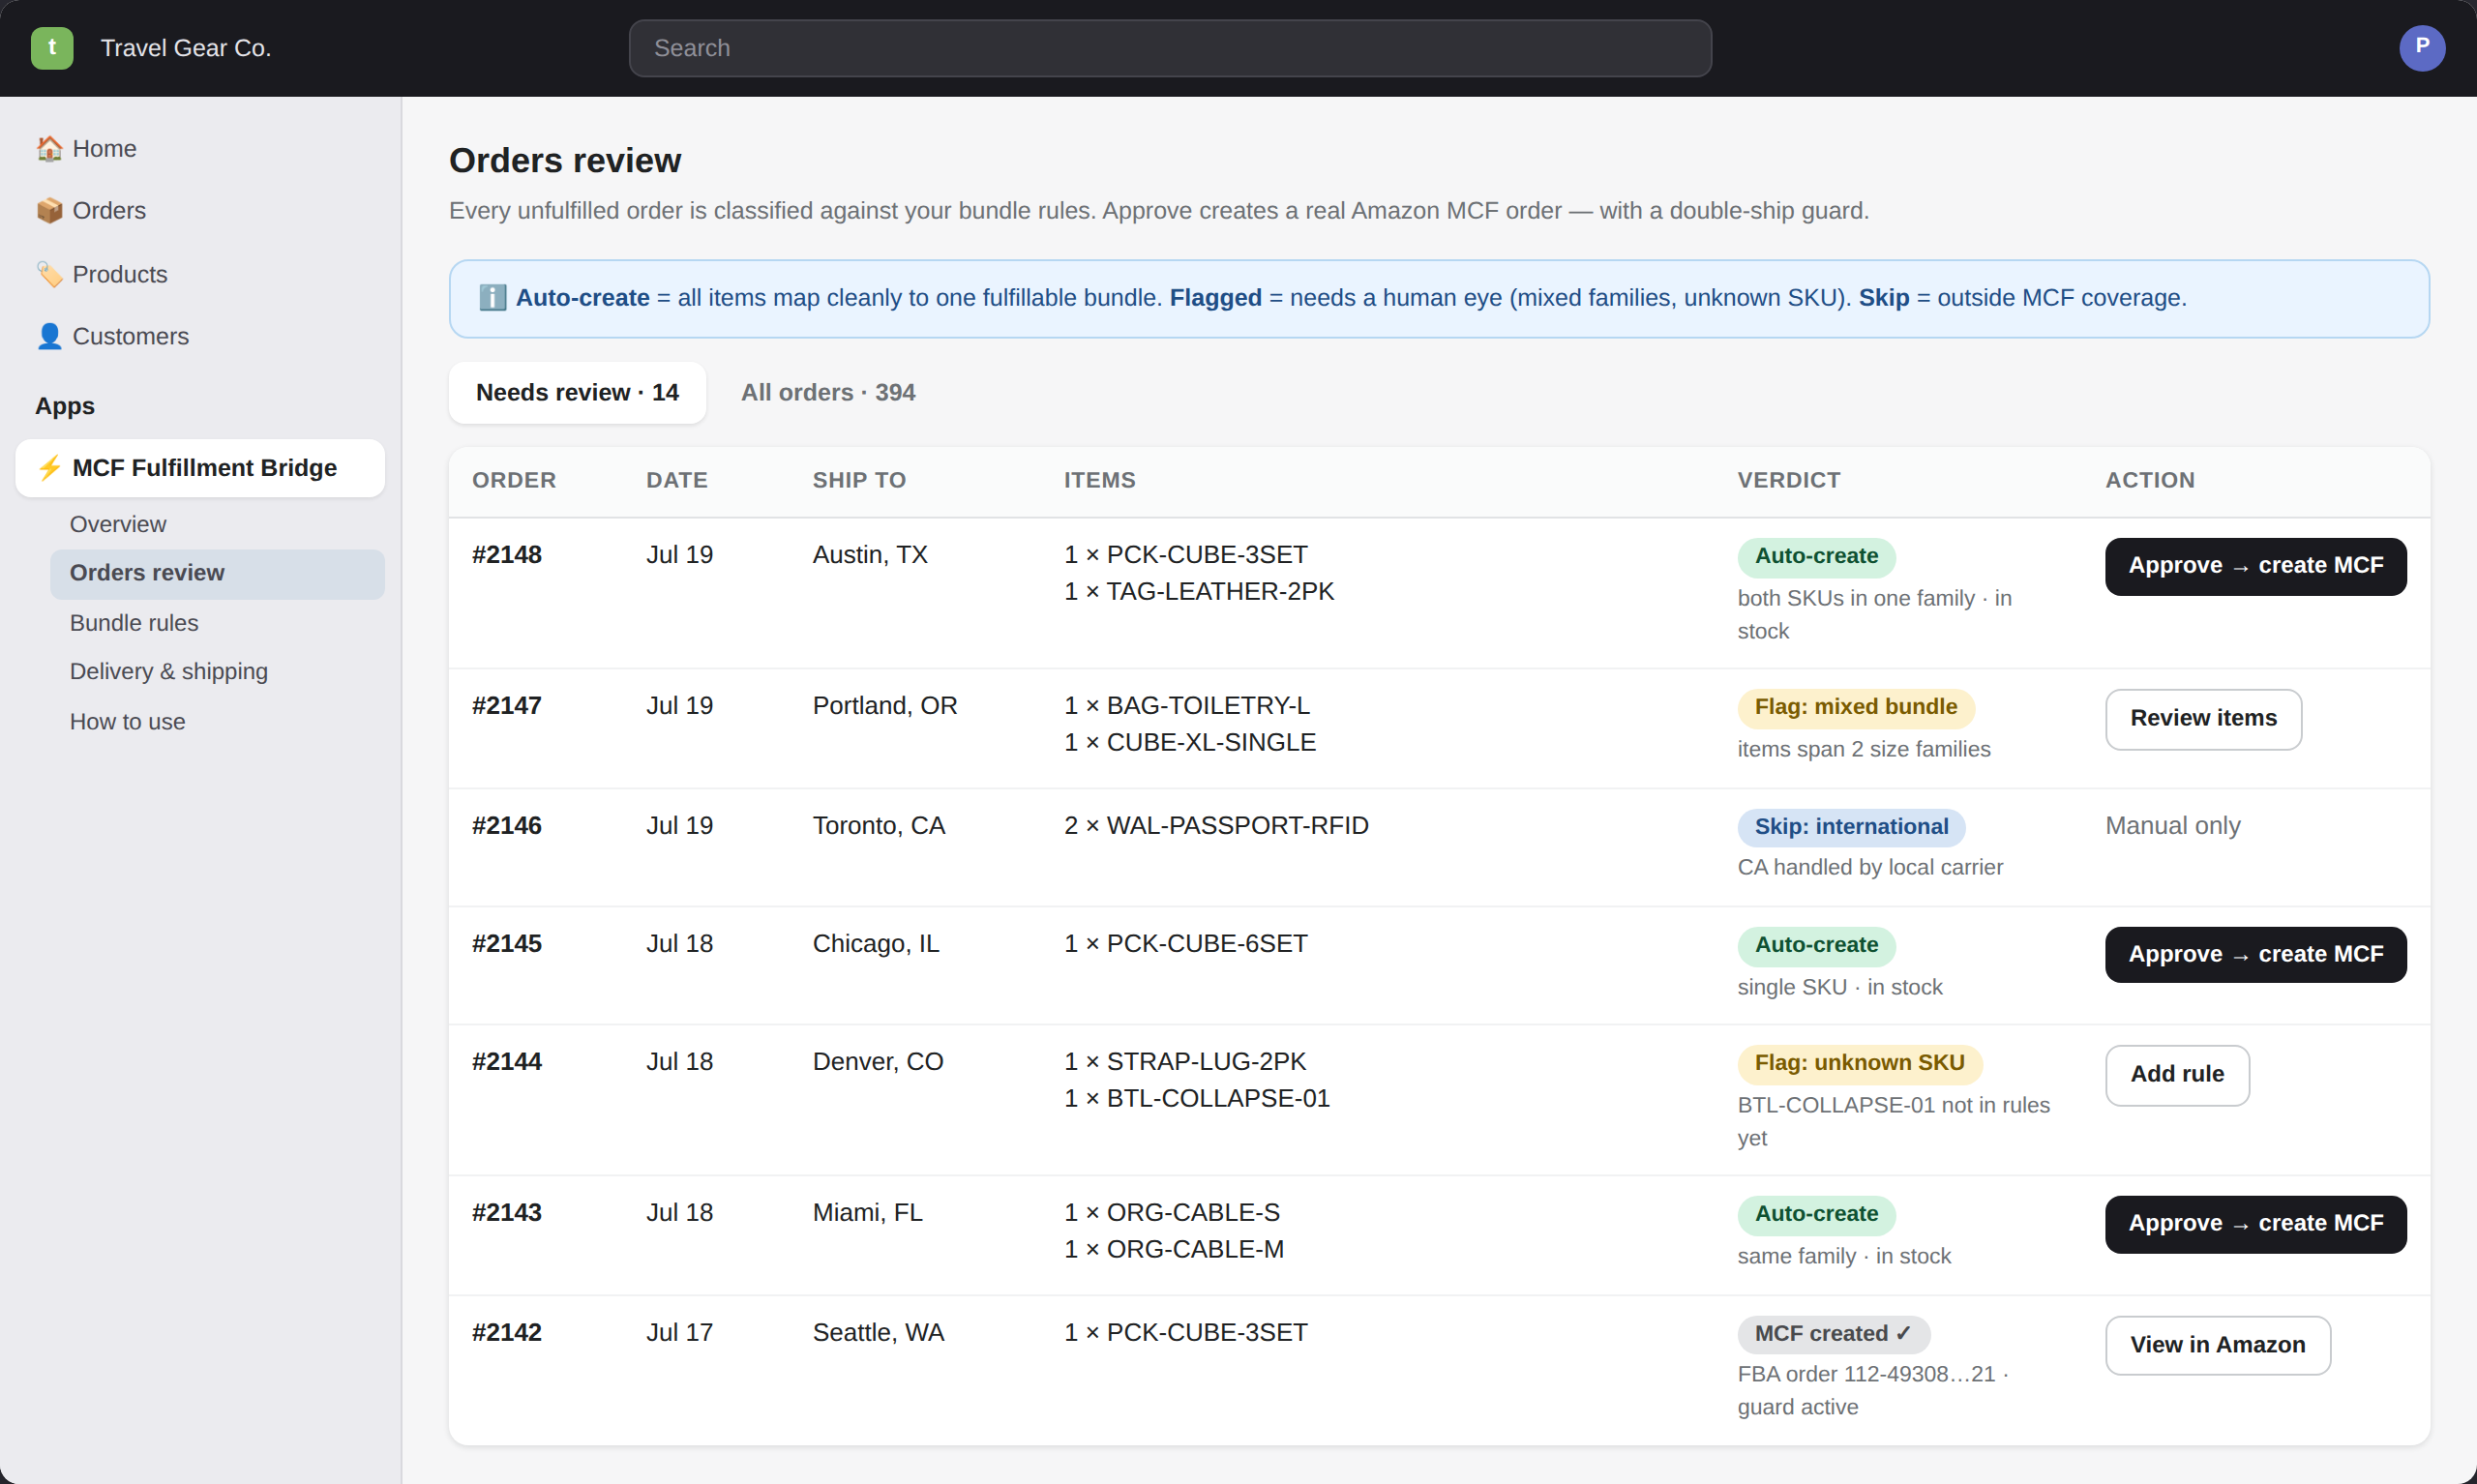
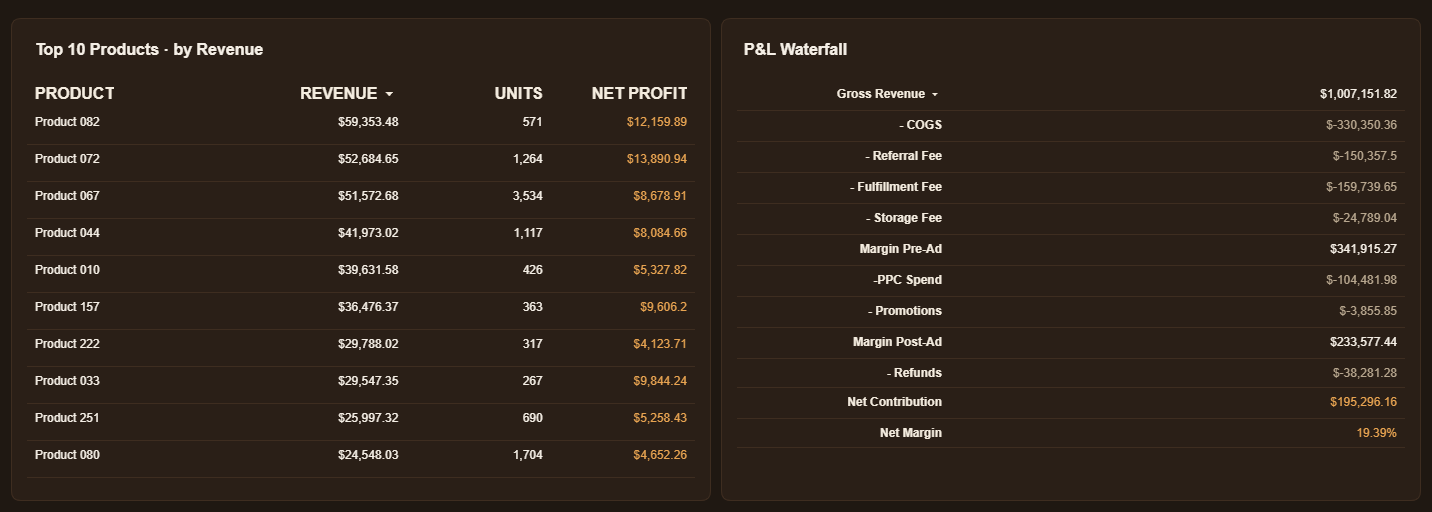
- ✓ Full P&L waterfall: revenue → COGS → FBA fees → PPC → refunds → net contribution, computed at SKU level
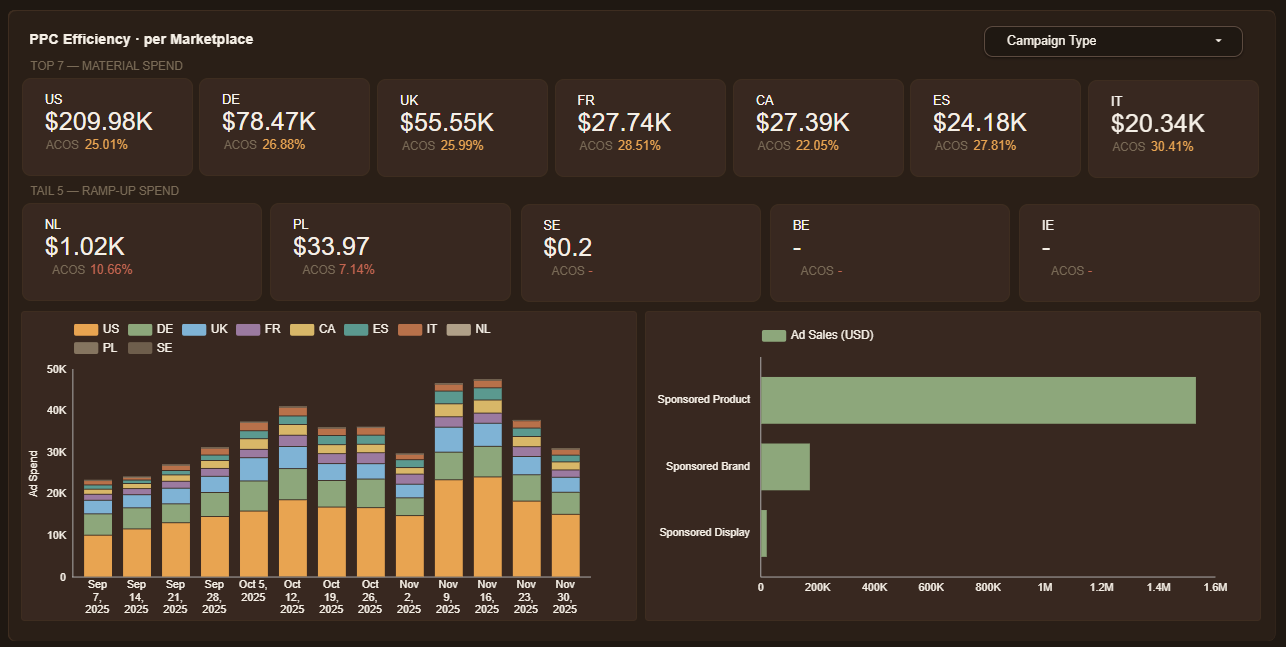
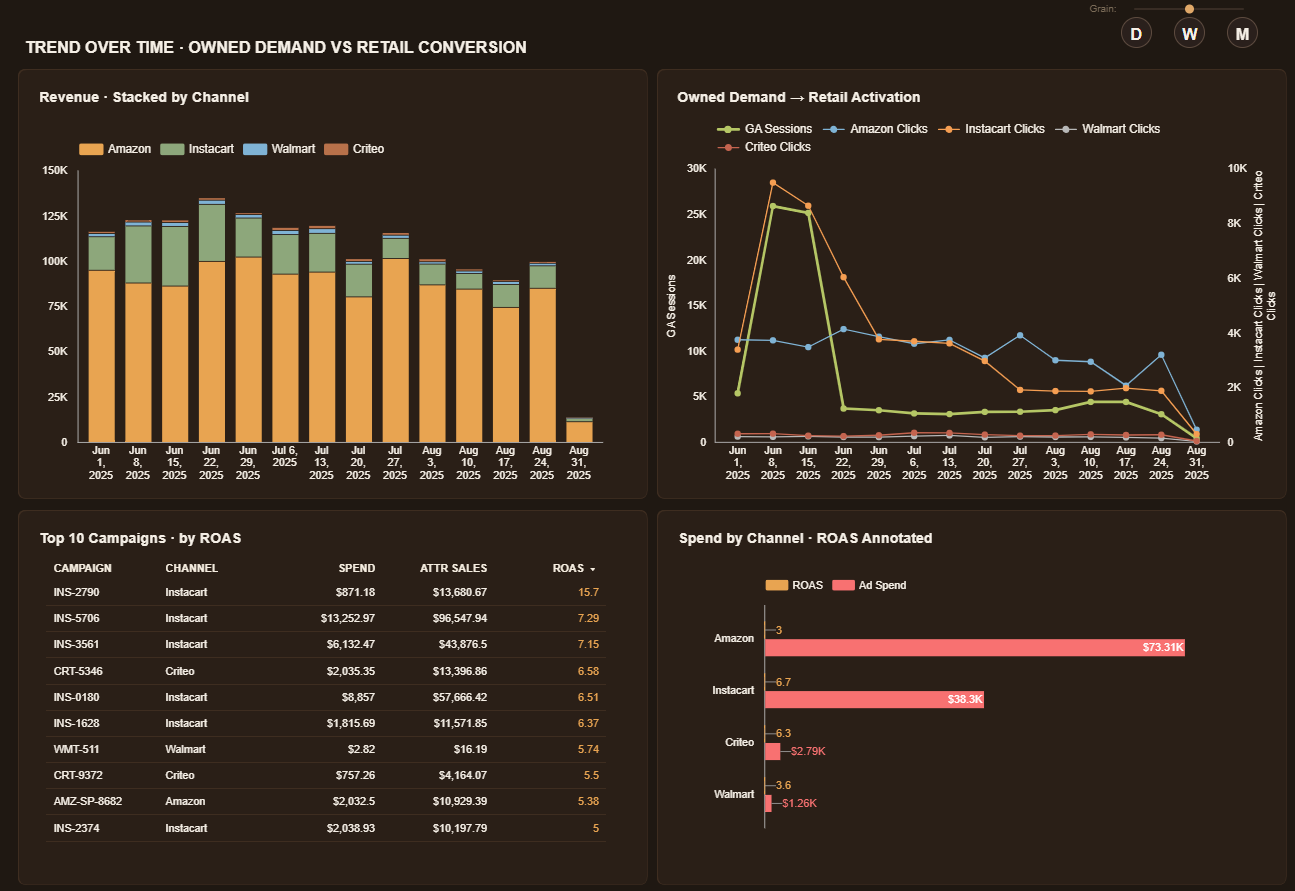
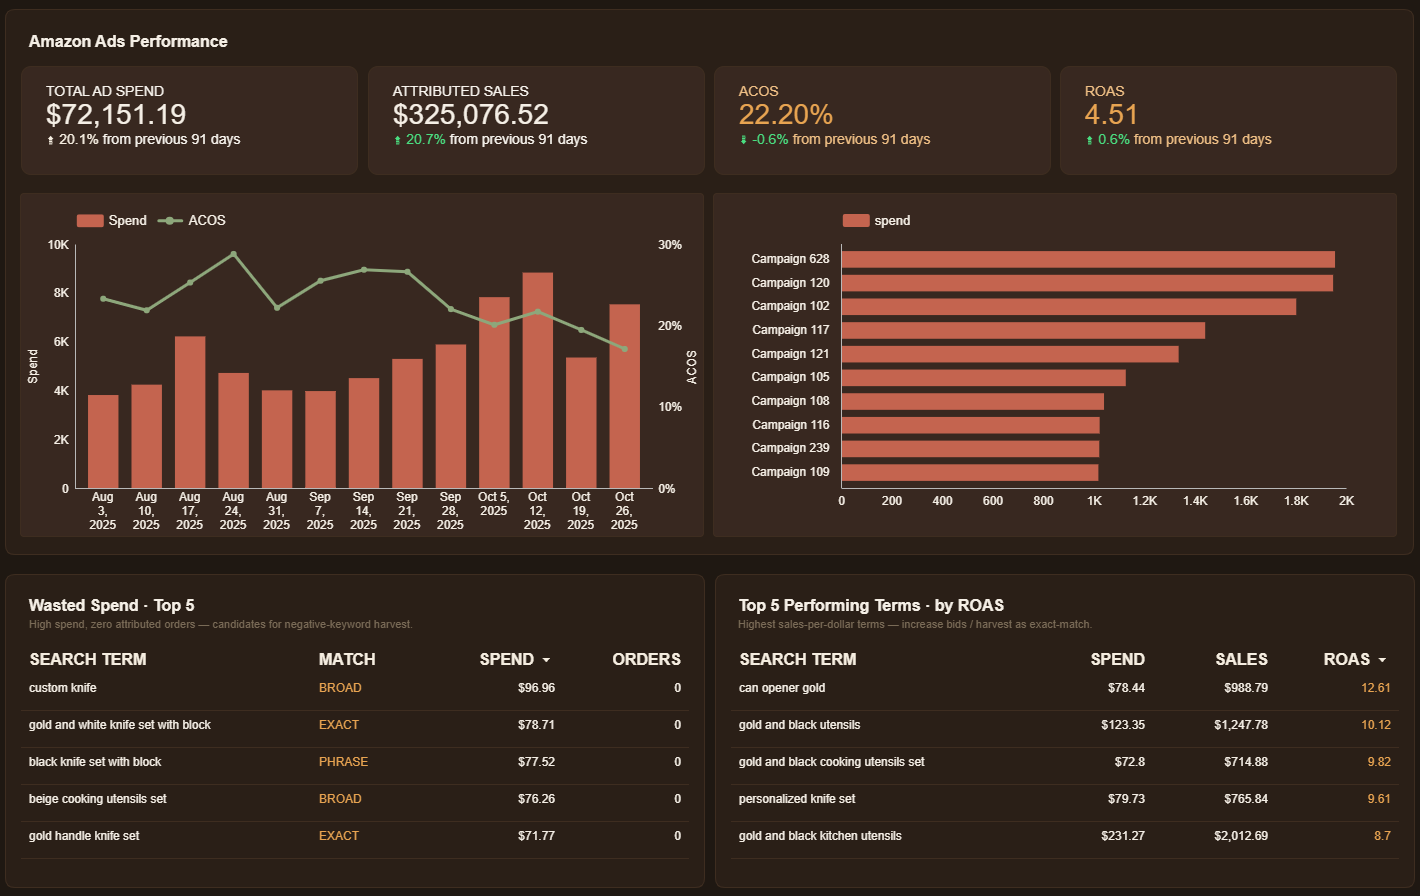
- ✓ PPC performance layer: spend / ACOS / ROAS by campaign, plus wasted-spend detection (high-spend, zero-conversion search terms)
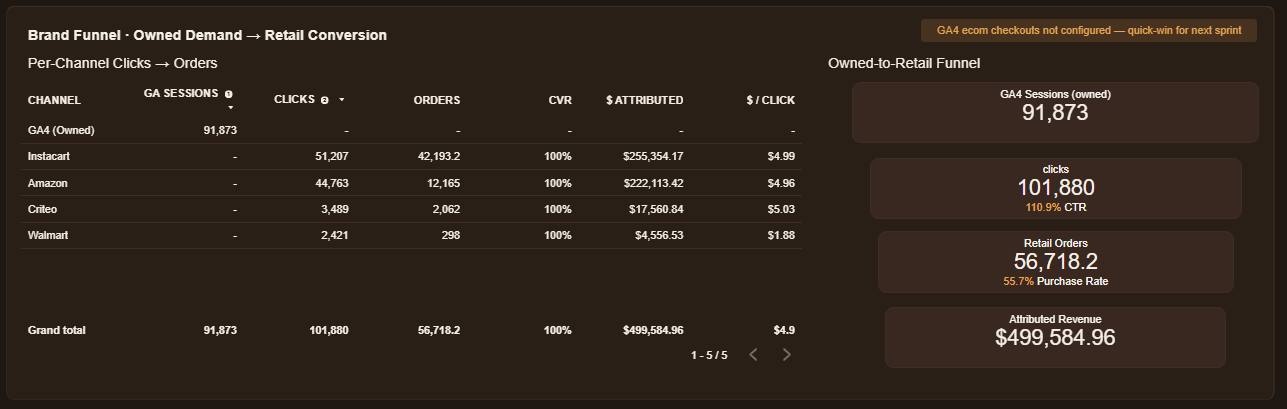
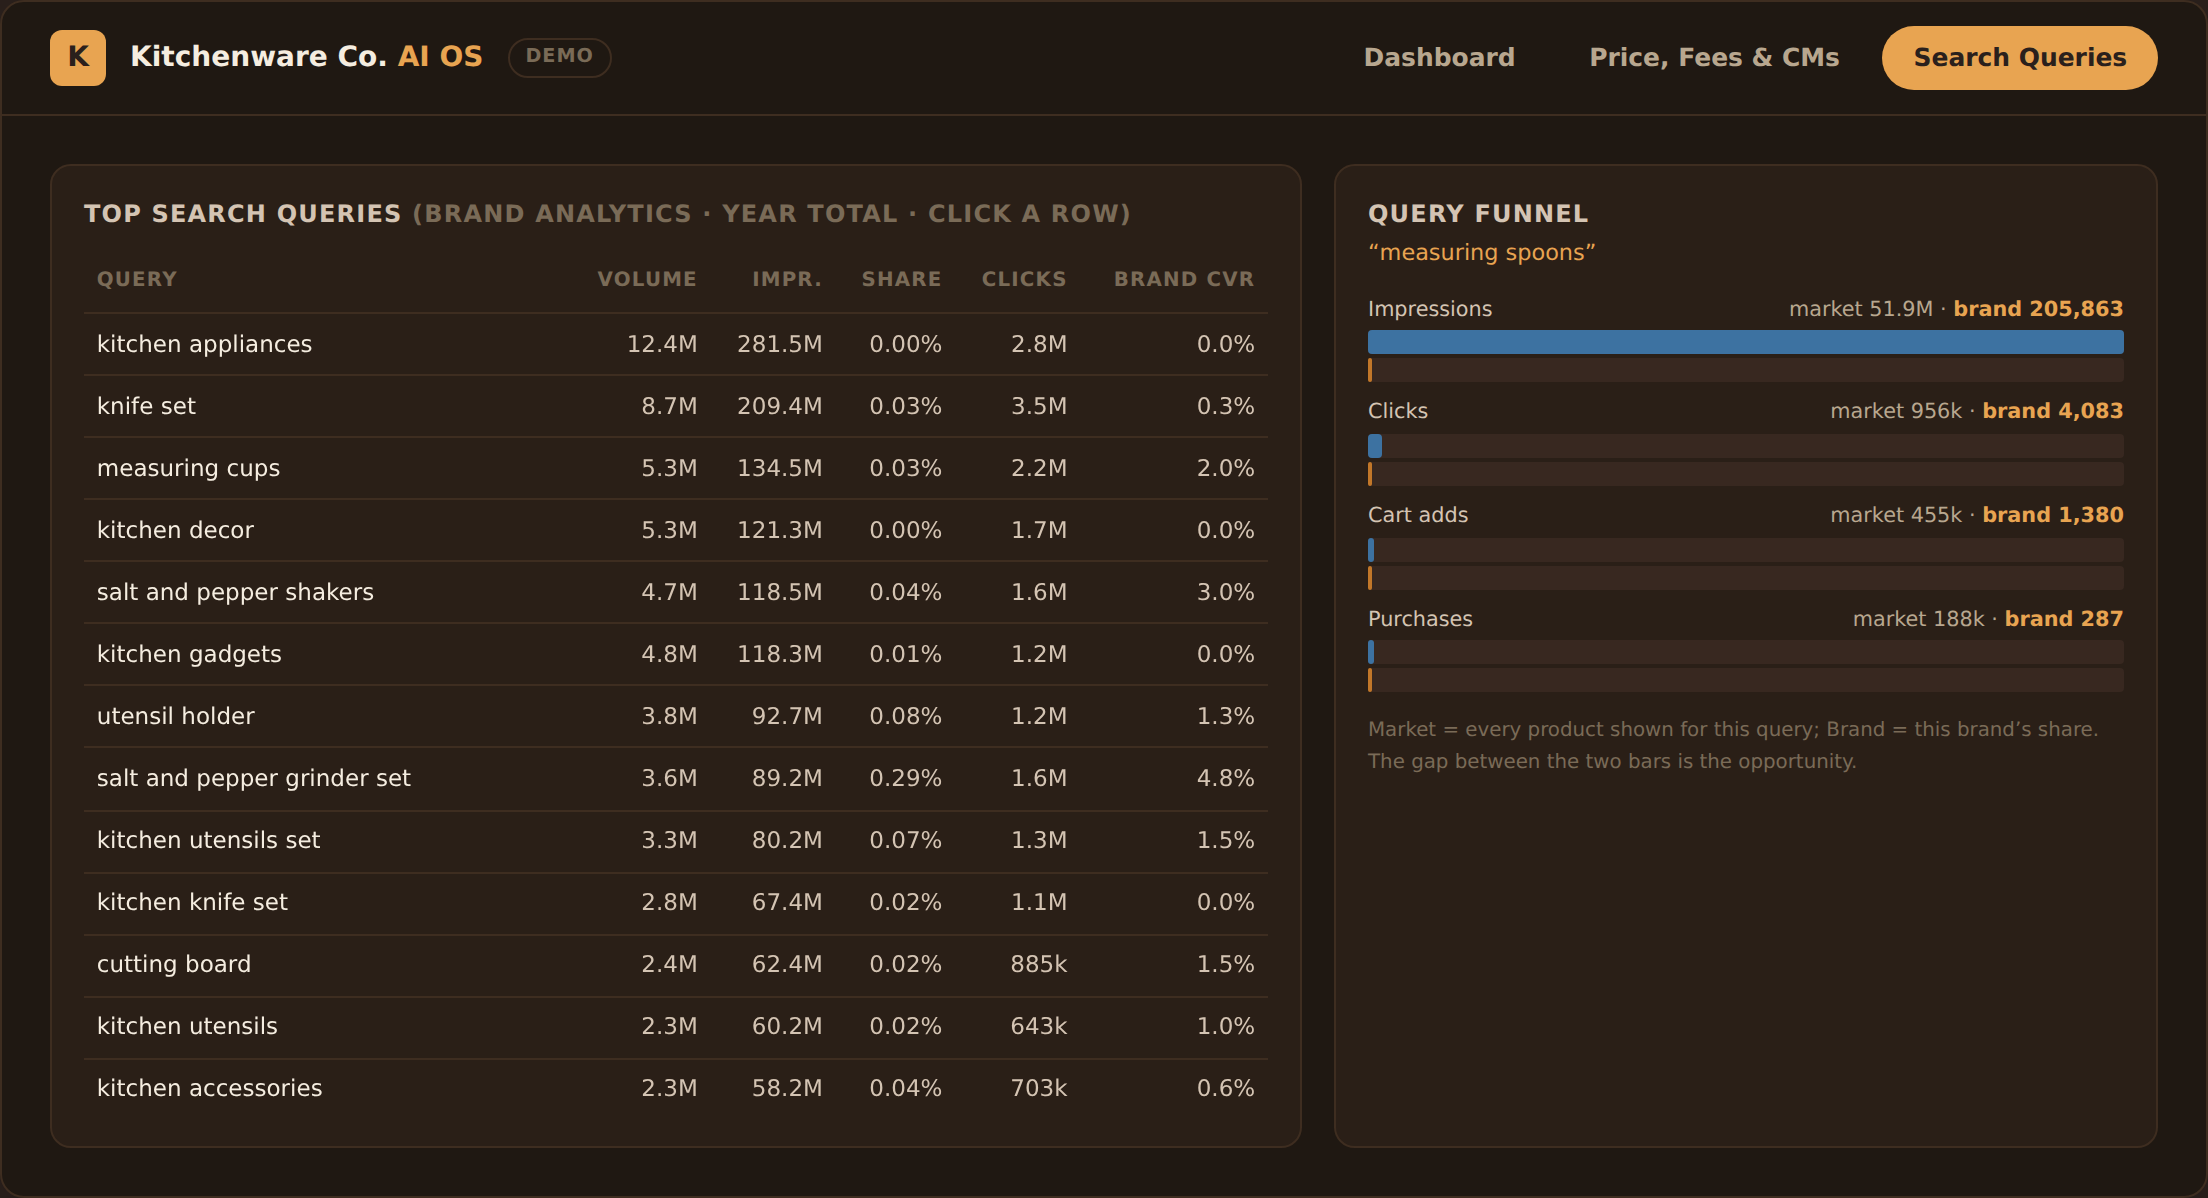
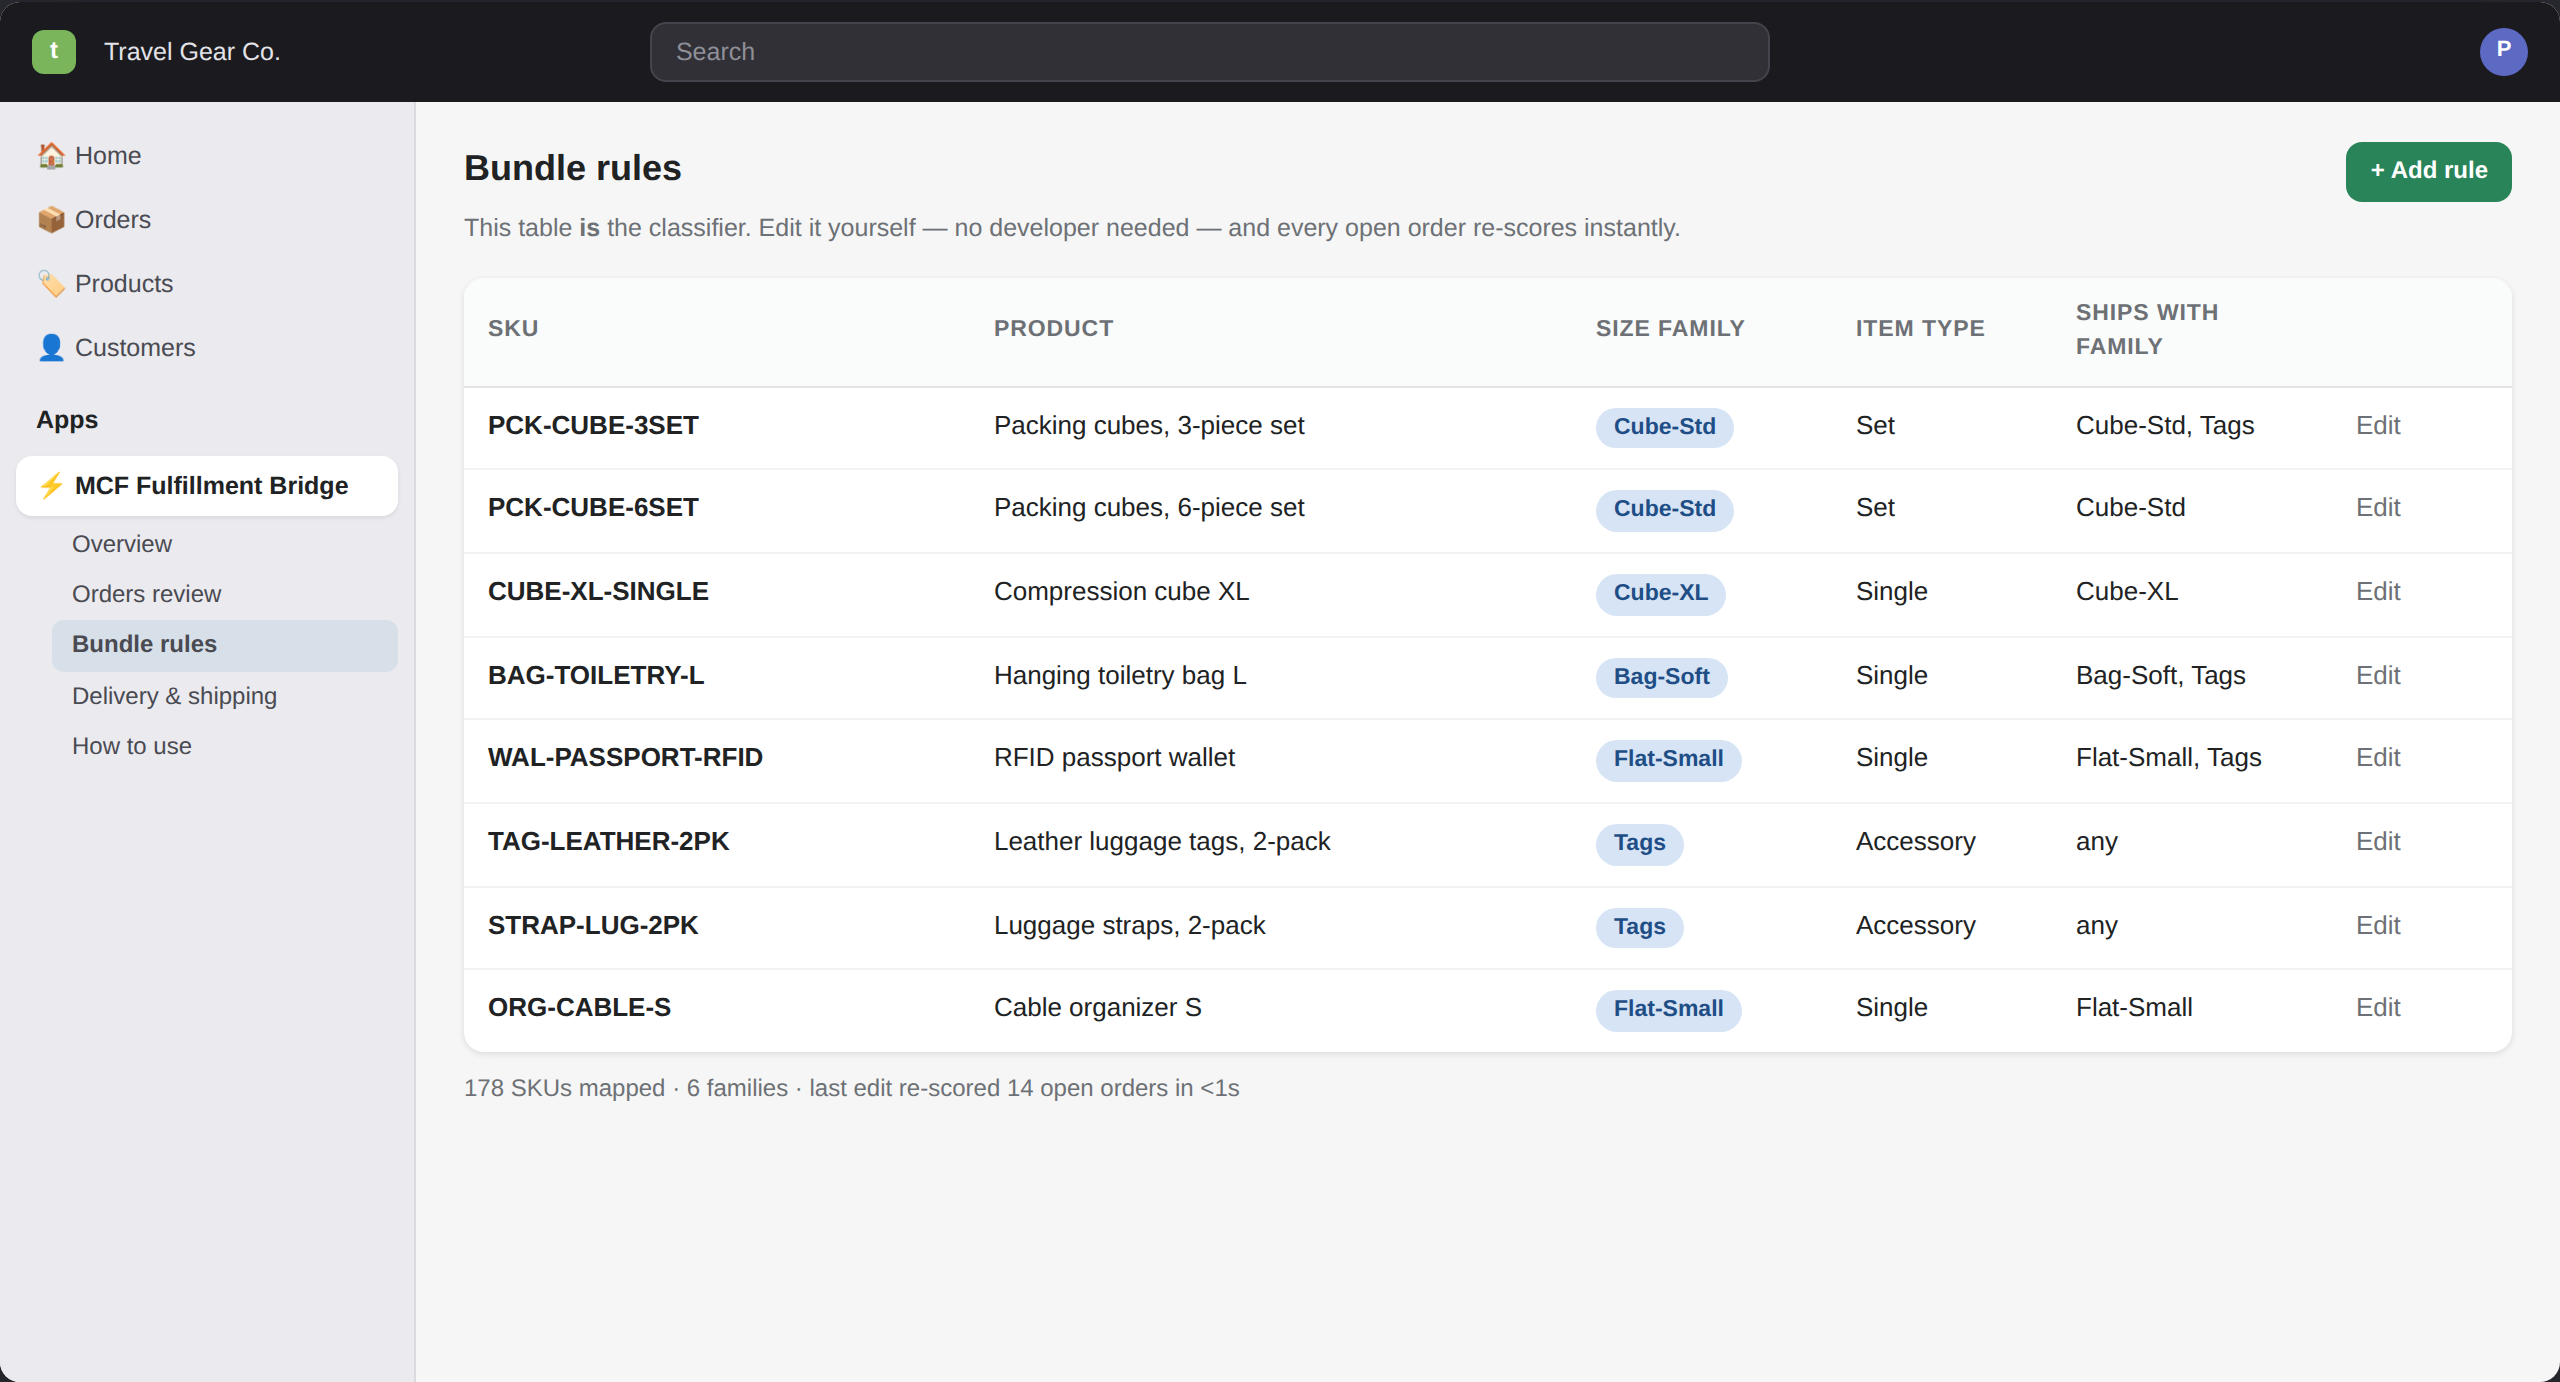
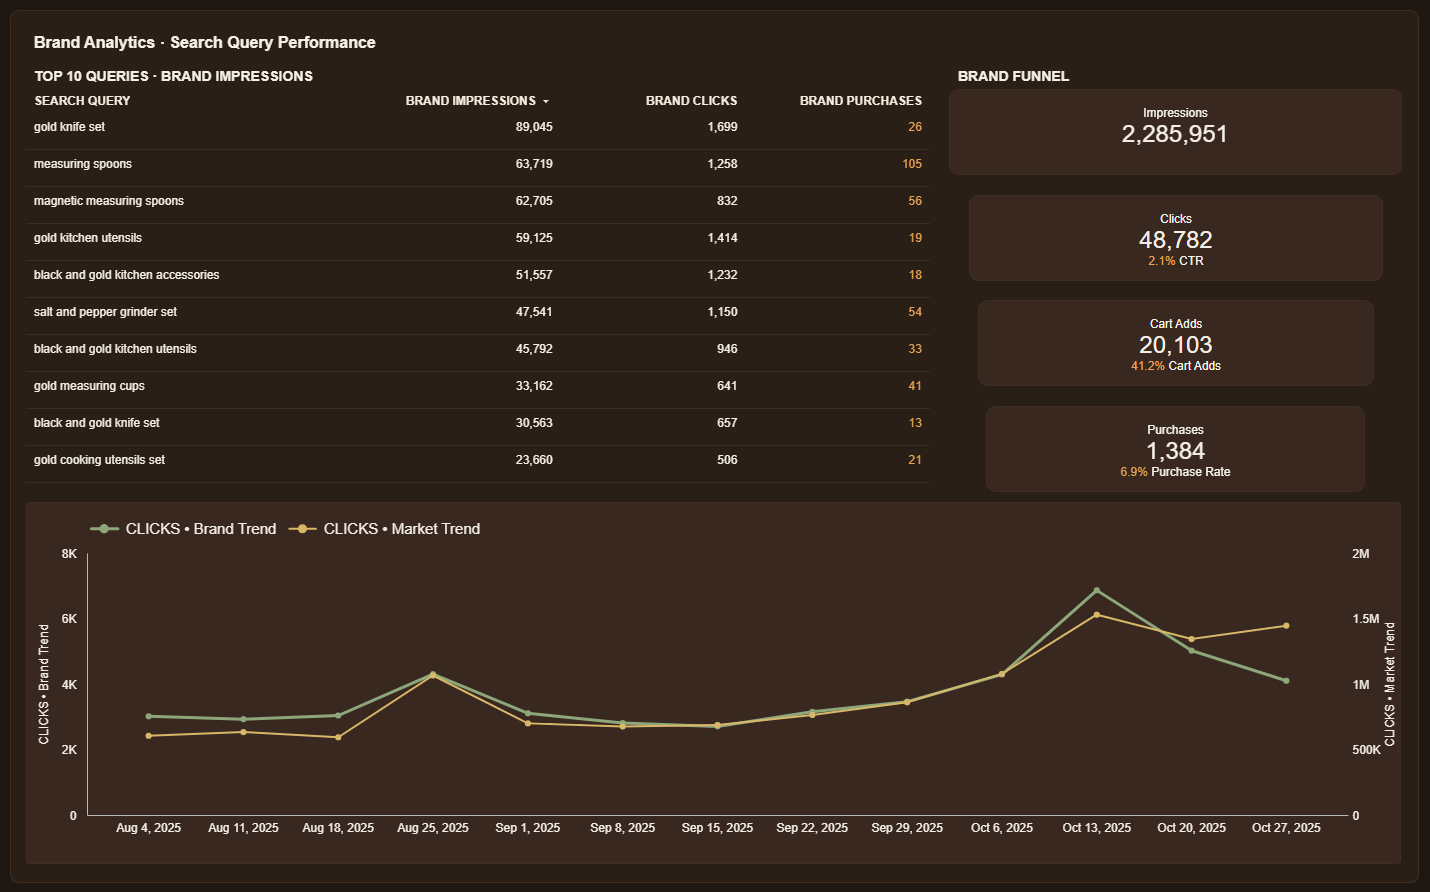
- ✓ Brand Analytics SQP integration — brand-vs-market funnel showing impressions → clicks → cart adds → purchases at the search-query level
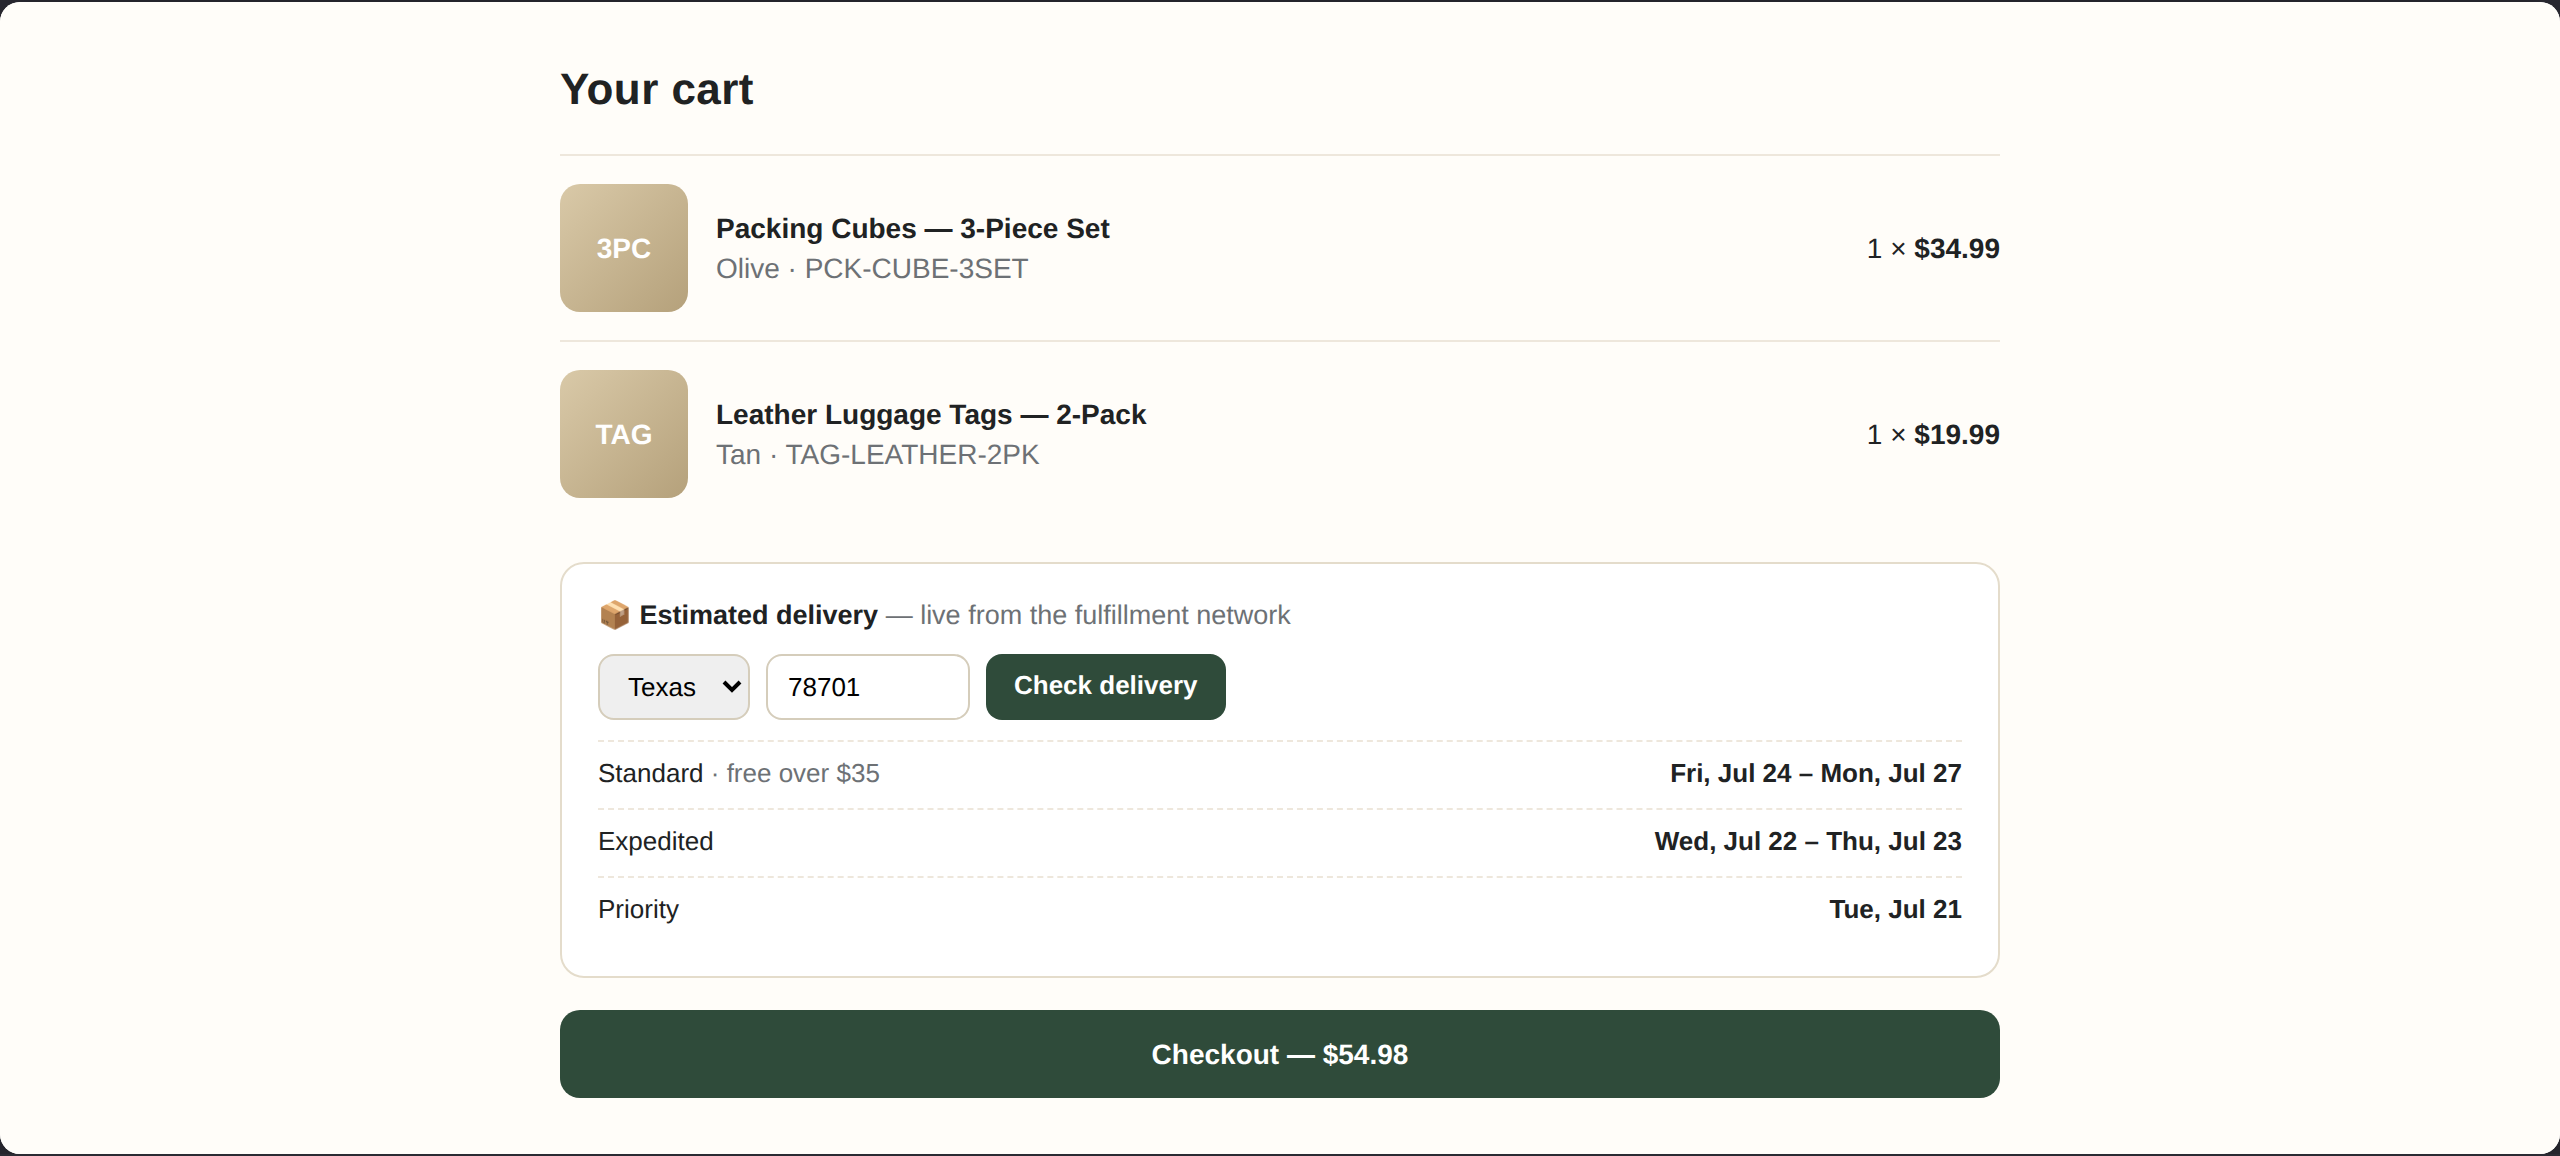
- ✓ Data Studio dashboard with daily / weekly / monthly grain switch, filtered to a rolling 12-month window
The Impact
- → Monday-morning reporting collapsed from half a day → one click
- → Surfaced ~$500 / week of wasted ad spend on zero-conversion search terms — first negative-keyword harvest paid for the project
- → Made margin visible at the SKU level for the first time — product mix decisions now backed by net margin, not gut feel
BigQuery
SP-API
Amazon Ads API
Brand Analytics
Data Studio
Python
n8n
Inside the Dashboard
See it live
Anonymized data — product names, dates, and identifiers masked. Dollar amounts are real.